
Image
|
Figure Caption
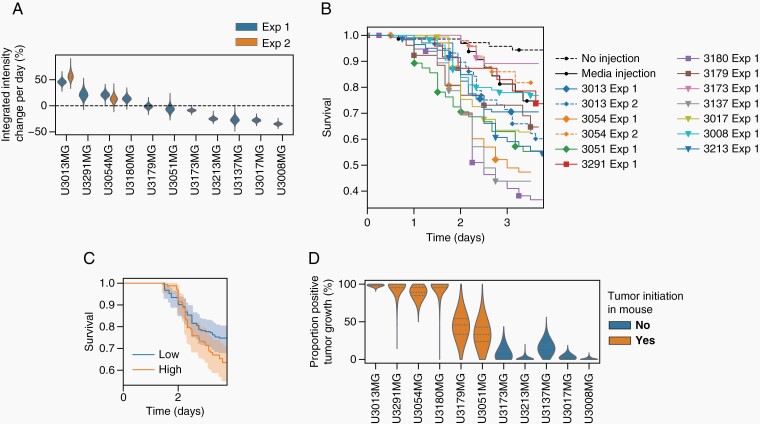
Fig. 3
Patient-derived cells (PDC) specific in vivo growth and survival. (A) Posterior distribution of PDC-specific proliferation rate. (B) PDC-specific effect on survival compared with negative control. (Rhombus: proliferative, Square: invasive, Triangle: non-proliferative). (C) Survival stratified by in vivo tumor proliferation. (D) Posterior distribution of tumor initiation capacity, compared to tumor initiation in orthotopic mouse xenografts.
Acknowledgments
This image is the copyrighted work of the attributed author or publisher, and
ZFIN has permission only to display this image to its users.
Additional permissions should be obtained from the applicable author or publisher of the image.
Full text @ Neuro Oncol.