
|
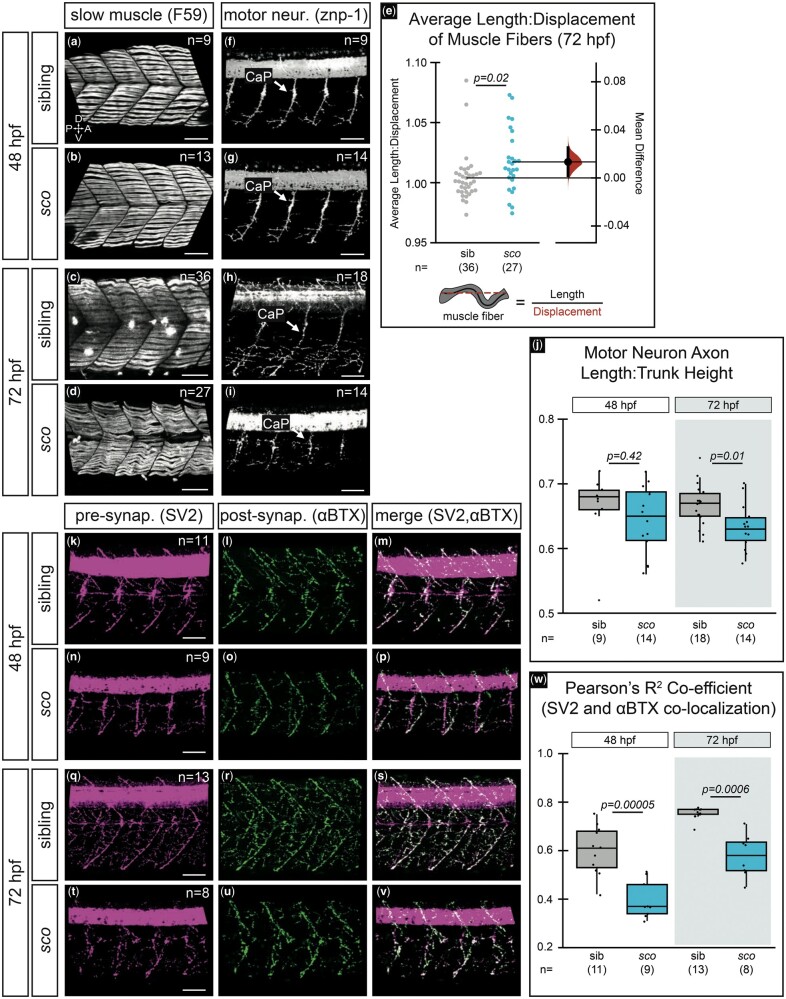
Fig. 4.
Shutdown corner has defective slow muscle fibers, motor neurons, and neuromuscular junctions. Slow muscle fibers (F59 staining) at 48 hpf a, b) and 72 hpf c, d) in siblings and sco mutants. e) Quantification of slow muscle fiber length-to-displacement ratio at 72 hpf presented as a Gardner-Altman estimation plot. Left dot plots, each data point represents an average of 8–14 fibers per single embryo measured as schematized. Right bootstrap sampling distribution, the mean difference between siblings and mutants is 0.0133 (95% CI: 0.00188, 0.0252). Mean difference depicted as a dot; 95% CI indicated by ends of vertical error bar reflects the effect size. f–j) Motor neurons (znp-1 staining) at 48 f, g) and 72 hpf h, i) in siblings and sco mutants. j) Quantification of motor neuron axon length normalized to trunk height. Three axons were measured per embryo; each point represents the average length ratio per embryo. k–w) Presynaptic terminals (SV-2 staining) and postsynaptic terminals (α-bungarotoxin or αBTX staining) at 48 hpf k–p) and 72 hpf q–v). SV-2 (k, n, q, t; magenta), αBTX (l, o, r, u; green), merge m, p, s, v). w) Quantification of SV-2 and αBTX colocalization at 48 and 72 hpf for one side of the trunk, per embryo. All images are 3D rendered, lateral views of the trunk region, dorsal to the yolk extension. Sample size (n) in images. A, anterior; CaP, caudal primary motor neuron; D, dorsal; P, posterior; V, ventral. Scale bar, 50 µm.