
|
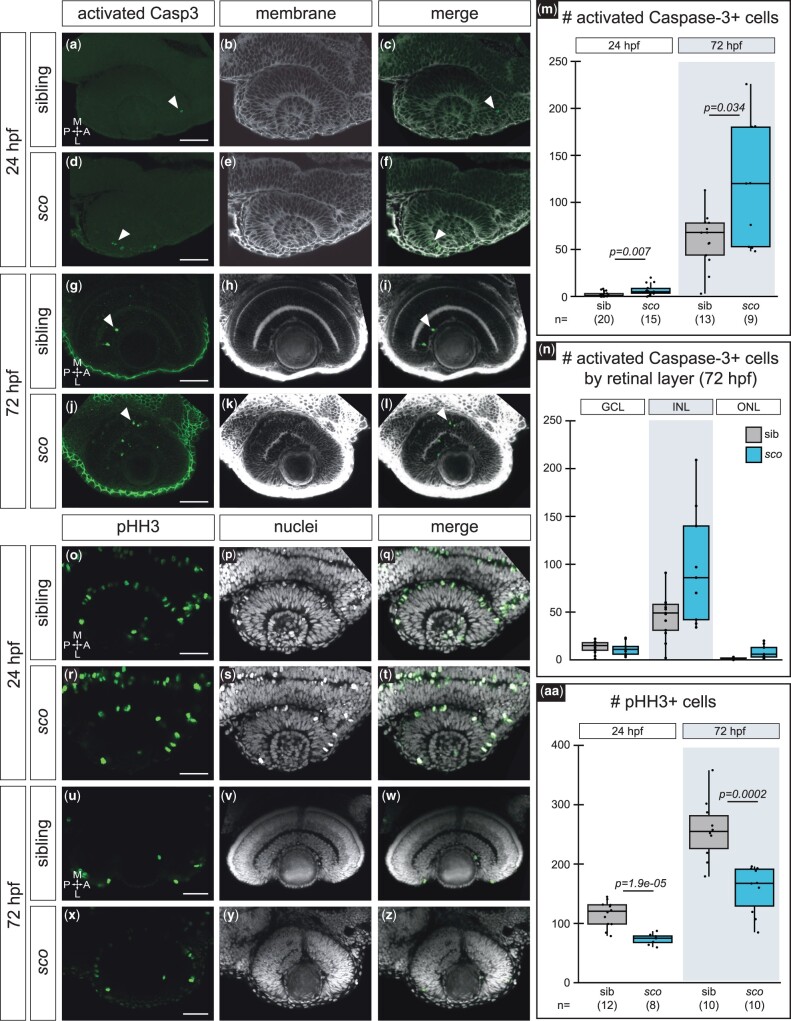
Fig. 3.
Cell death and proliferation are affected in the shutdown corner retina. a–n) Activated caspase-3-positive cells at 24 hpf a–f) and 72 hpf g–l) in siblings and sco mutants. Dorsal (24 hpf) or ventral (72 hpf) view, single confocal section from 3D datasets of antibody-stained Tg(bactin2:EGFP-CAAX) samples. Activated caspase-3 (a, d, g, j; green), cell membranes (b, e, h, k; grayscale, EGFP-CAAX), merge (c, f, i, l). Arrowheads (a, c, d, f, g, i, j, l), activated caspase-3 positive cells in the retina. m) Quantification of cells positive for activated caspase-3 in the retina, per embryo. n) Quantification of cells positive for activated caspase-3 at 72 hpf in each retinal layer, per embryo. o–aa) Phospho-histone H3 (pHH3)-positive cells at 24 hpf o–t) and 72 hpf u–z) in siblings and sco mutants. Dorsal (24 hpf) or ventral (72 hpf) view, single confocal section from 3D datasets of antibody-stained samples. pHH3 (o, r, u, x; green), nuclei (p, s, v, y; grayscale, TO-PRO-3), and merge (q, t, w, z). aa) Quantification of cells positive for pHH3 in the retina, per embryo. GCL, ganglion cell layer; INL, inner nuclear layer; ONL, outer nuclear layer; A, anterior; L, lateral; M, medial; P, posterior. Scale bar, 50 µm.