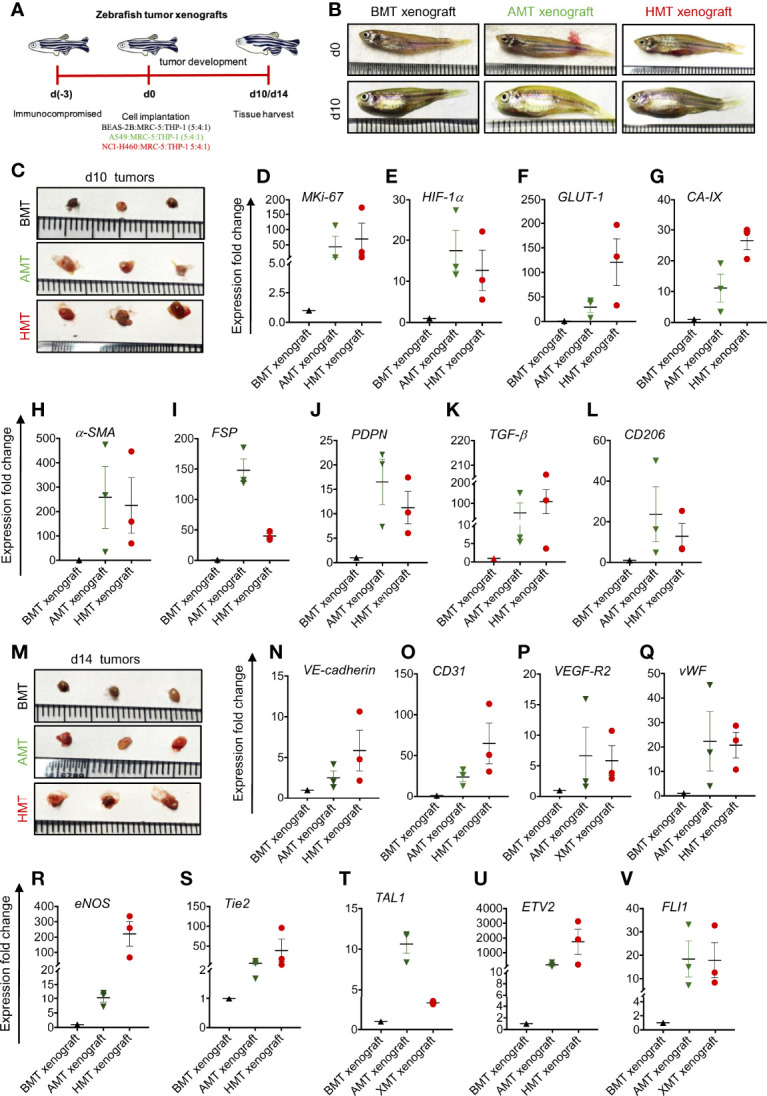
Validation of 3D tumor spheroid data in zebrafish xenograft model. (A) Schematic diagram representing experimental design indicating days on which zebrafish was immunocompromised [d(-3)], mixed cell population was injected into the peritoneal cavity [d(0)], and BMT, AMT, and HMT xenografts were collected on d10 and d14. (B) Representative photographs of zebrafish on d0, and d10 of tumor development. (C) Representative photographs of zebrafish BMT, AMT, and HMT tumor xenografts (n=3) on day 10. (D-L) RT-qPCR analysis of different gene expression in BMT xenograft (black, n=3), AMT xenograft (green, n=3), and HMT xenograft (red, n=3) on day 10. (D)MKi-67 proliferation marker; (E–G) hypoxia related markers- HIF-1α(E), GLUT-1(F), and CA-IX(G); (H–K) cancer associated fibroblast markers- α-SMA(H), FSP(I), PDPN(J) and TGF-β(K); (L) tumor associated macrophage marker CD206; (M) Representative photographs of zebrafish BMT, AMT, and HMT xenografts (n=3) on day 14. (N–V) RT-qPCR analysis of different gene expression in these xenografts on day 14. (N–R) endothelial cell markers- VE-cadherin(N), CD31(O), VEGF-R2(P), vWF(Q), eNOS(R); (S–V) angiogenic regulators Tie2(S), TAL1(T), ETV2(U), FLI1(V). GAPDH was used as loading control for RT-qPCR analysis. All experiments were performed in triplicate (n=3).
Acknowledgments
This image is the copyrighted work of the attributed author or publisher, and
ZFIN has permission only to display this image to its users.
Additional permissions should be obtained from the applicable author or publisher of the image.
Full text @ Front Oncol
Your Input Welcome
Thank you for submitting comments. Your input has been emailed to ZFIN curators who may contact you if
additional information is required.
Oops. Something went wrong. Please try again later.