
Fig. 9
- ID
- ZDB-IMAGE-220715-14
- Publication
- Liu et al., 2022 - Cre/lox regulated conditional rescue and inactivation with zebrafish UFlip alleles generated by CRISPR-Cas9 targeted integration
- All Figures
- Figures for Liu et al., 2022
|
Fig. 9
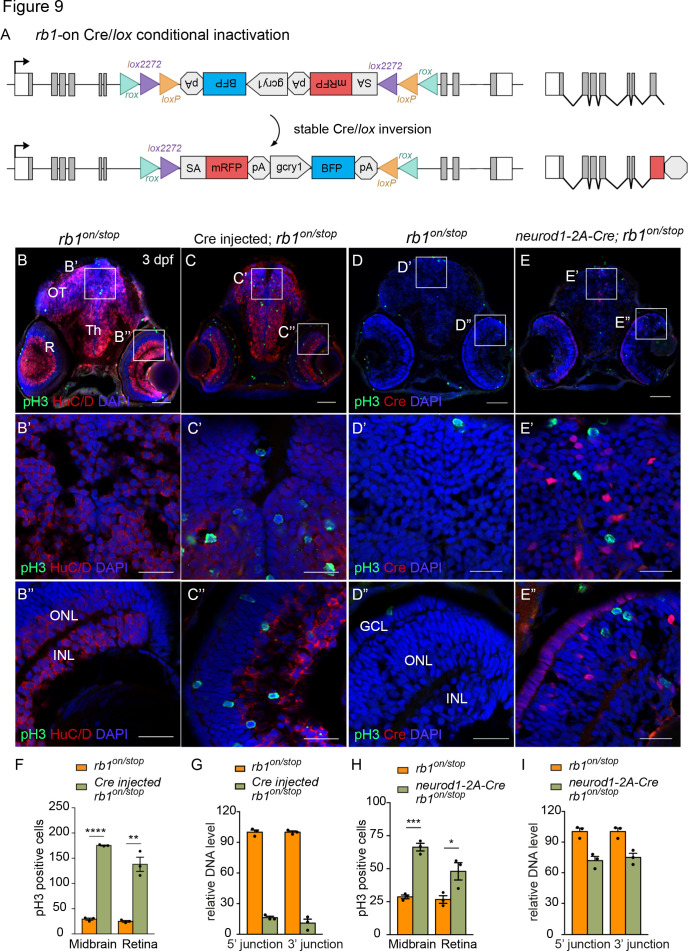
(A) Diagram of expected Cre mediated inversion of rb1on to ‘off’ orientation. (B, C) pH3 and HuC/D labeling of larval sectioned head tissue from 5 dpf transheterozygous rb1on/stop (B – B”) and Cre injected rb1on/stop (C – C”). (D, E) pH3 and Cre labeling of larval sectioned head tissue from 5 dpf transheterozygous rb1on/stop (D – D”) and neurod1-2A-Cre; rb1on/stop (E – E”). (F) Quantification of pH3-positive cells in control rb1on/stop (n=3) and Cre rb1on/stop (n=3) injected midbrain (**** p<0.0001) and retina (** p<0.01). (G) Genomic DNA qPCR quantification of rb1onoriginal orientation DNA 5’ and 3’ junctions in control rb1on/stop (n=3) and Cre injected rb1on/stop (n=3). (H) Quantification of pH3-positive cells in control rb1on/stop (n=3) and neurod1-2A-Cre; rb1on/stop (n=3) midbrain (*** p<0.001) and retina (* p<0.05). (I) Genomic DNA qPCR quantification of rb1on original orientation DNA 5’ and 3’ junctions in control rb1on/stop (n=3) control and neurod1-2A-Cre; rb1on/stop (n=3). Error bars represent mean ± s.e.m. with two-tailed t-test. Scale bars: 50 μm (B - E), 20 μm (B’ – E”).