
Fig. 6
- ID
- ZDB-IMAGE-220715-11
- Publication
- Liu et al., 2022 - Cre/lox regulated conditional rescue and inactivation with zebrafish UFlip alleles generated by CRISPR-Cas9 targeted integration
- All Figures
- Figures for Liu et al., 2022
|
Fig. 6
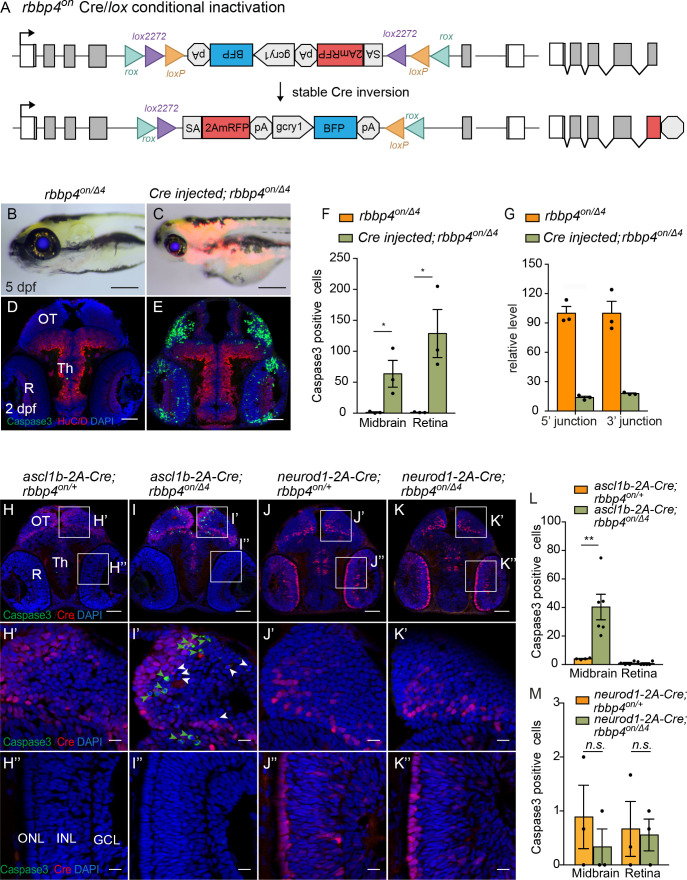
(A) Diagram of expected Cre-mediated inversion of rbbp4on to “off” orientation. (B) Normal morphological phenotype in 5 dpf transheterozygous rbbp4on/Δ4larva. (C) Induction of microcephaly and microphthalmia and mRFP expression in Cre injected 5 dpf transheterozygous rbbp4on/Δ4larva. (D) Absence of activated caspase-3a labeling in sectioned tissue from 2 dpf uninjected transheterozygous rbbp4on/Δ4embryo. (E) Activated caspase-3a labeling in the midbrain and retina of 2 dpf transheterozygous rbbp4on/Δ4embryo after Cre injection. (F) Quantification of caspase-3a labeling in control rbbp4on/Δ4(n=3) and Cre-injected rbbp4on/Δ4(n=3) midbrain (* p<0.05) and retina (* p<0.05). (G) Genomic DNA qPCR quantification of rbbp4on original orientation 5’ and 3 junctions in control rbbp4on (n=3) and Cre injected rbbp4on/Δ4 (n=3). (H – K”) Activated caspase-3a and Cre labeling in sectioned head tissue from 2 dpf ascl1b-2A-Cre; rbbp4D4/+ (H-H"), ascl1b-2A-Cre; rbbp4on/Δ4 (I-I"), neurod1-2A-Cre; rbbp4Δ4/+ (J-J"), and neurod1-2A-Cre; rbbp4on/Δ4 (K-K"), embryos. Green arrowheads, activated caspase-3a-positive cells. White arrowheads, hypercondensed and fragmented nuclei. (L) Quantification of caspase-3a labeling in ascl1b-2A-Cre; rbbp4on/+ (n=4) and ascl1b-2A-Cre; rbbp4on/Δ4 (n=6) midbrain (** p<0.01) and retina (n.s. p=0.8543). (M) Quantification of caspase-3a labeling in neurod1-2A-Cre; rbbp4on/+ (n=3) and neurod1-2A-Cre; rbbp4on/Δ4 (n=3) midbrain (n.s. p=0.3739) and retina (n.s. p=0.6433). OT, optic tectum; R, retina; Th, thalamic region. Error bars represent mean ± s.e.m. with two-tailed t-test. Scale bars: 200 μm (B, C), 50 μm (D, E, H – K). 10 μm (H’ – K”).