
Fig. 4
- ID
- ZDB-IMAGE-220714-4
- Publication
- Kuromiya et al., 2022 - Calcium sparks enhance the tissue fluidity within epithelial layers and promote apical extrusion of transformed cells
- All Figures
- Figures for Kuromiya et al., 2022
|
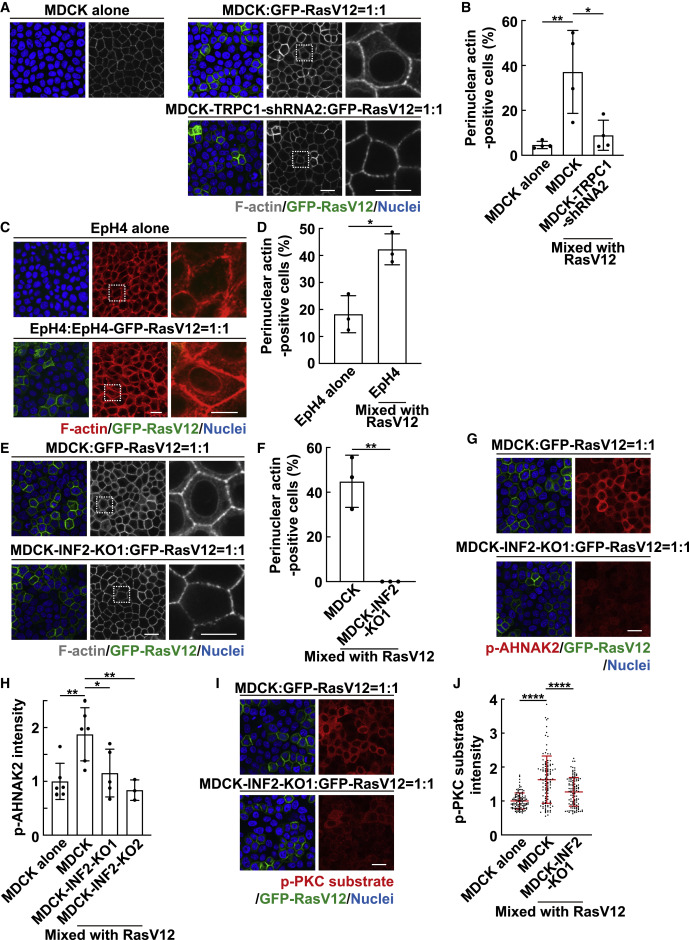
Fig. 4 Figure 4. INF2 induces perinuclear actin and AHNAK2 phosphorylation (A and B) TRPC1-mediated perinuclear actin in normal cells mix cultured with RasV12-transformed cells. (A) Fluorescence images of perinuclear actin. Magnified images of the white dashed regions are shown at right. (B) Quantification of perinuclear actin-positive cells. Data are means ± SDs from 4 independent experiments. ∗p < 0.05 and ∗∗p < 0.01 (1-way ANOVA with Dunnett’s test); n = 1,009, 672, and 719 cells. (C and D) Perinuclear actin in EpH4 cells. (C) Fluorescence images of perinuclear actin. Magnified images of the white dashed regions are shown at right. (D) Quantification of perinuclear actin-positive cells. Data are means ± SDs from 3 independent experiments. ∗p < 0.05 (unpaired 2-tailed Student’s t test); n = 885 and 488 cells. (E and F) Effect of INF2-knockout (KO) on perinuclear actin. (E) Fluorescence images of perinuclear actin. Magnified images of the white dashed regions are shown at right. (F) Quantification of perinuclear actin-positive cells. Data are means ± SDs from 3 independent experiments. ∗∗p < 0.01 (unpaired 2-tailed Student’s t test); n = 383 and 348 cells. (G and H) Effect of INF2-KO on AHNAK2 phosphorylation. (G) Immunofluorescence images of p-AHNAK2. (H) Quantification of the immunofluorescence intensity of p-AHNAK2. Values are expressed as a ratio relative to the average of MDCK alone. Data are means ± SDs from 6 (MDCK alone and MDCK mixed with RasV12), 5 (MDCK-INF2-KO1 mixed with RasV12), or 3 (MDCK-INF2-KO2 mixed with RasV12) independent experiments. ∗p < 0.05 and ∗∗p < 0.01 (1-way ANOVA with Dunnett’s test); n = 215, 215, 185, and 85 cells. (I and J) Effect of INF2-KO on p-PKC substrate. (I) Immunofluorescence images of p-PKC substrate. (J) Quantification of the immunofluorescence intensity of p-PKC substrate. Values are expressed as a ratio relative to the average of MDCK alone. Cumulative data from 3 independent experiments are shown as means ± SDs. ∗∗∗∗p < 0.0001 (1-way ANOVA with Dunnett’s test); n = 110 cells for each experimental condition. (A, C, E, G, and I) Scale bars, 20 and 10 μm (magnified images). See also Figure S4.