
|
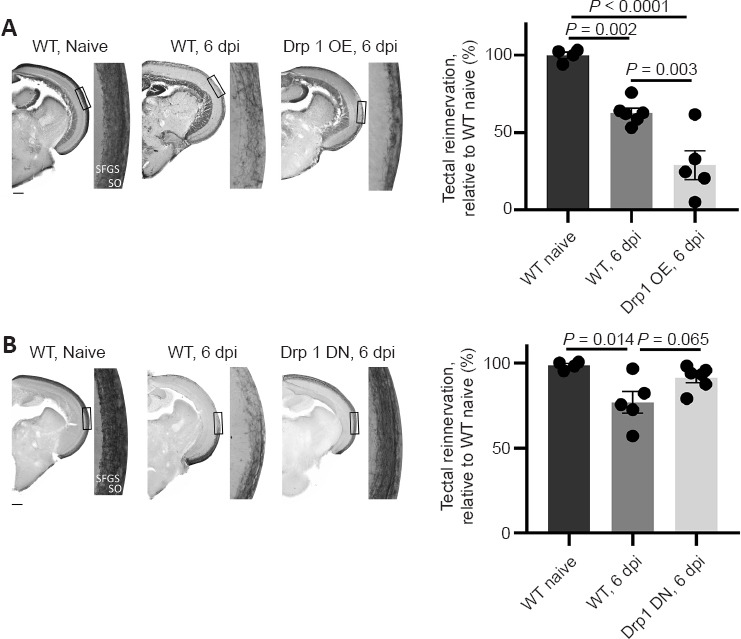
Fig. 6
Quantification of tectal (re)innervation in WT, Drp1 OE, and Drp1 DN zebrafish at 6 days post-ONC (overview images and high magnification images from boxed areas).
(A) Representative overview and detailed images (box), as well as semi-quantitative analysis of the tectal area covered by RGC axons reveal a significant reduction in optic tectum reinnervation at 6 days after ONC in the Drp1 OE condition, as compared to WT fish. (B) In Drp1 DN zebrafish, tectal reinnervation was enhanced, in comparison to WT animals. Scale bars: 200 µm. Data represent the mean ± SEM, n = 4–6 fish per condition, one-way analysis of variance followed by Tukey’s post hoc test. DN: Dominant negative; Dpi: days post-injury; Drp1: dynamin-related protein 1; OE: overexpression; ONC: optic nerve crush; WT: wild-type.