
Fig. 2
- ID
- ZDB-IMAGE-220714-2
- Publication
- Kuromiya et al., 2022 - Calcium sparks enhance the tissue fluidity within epithelial layers and promote apical extrusion of transformed cells
- All Figures
- Figures for Kuromiya et al., 2022
|
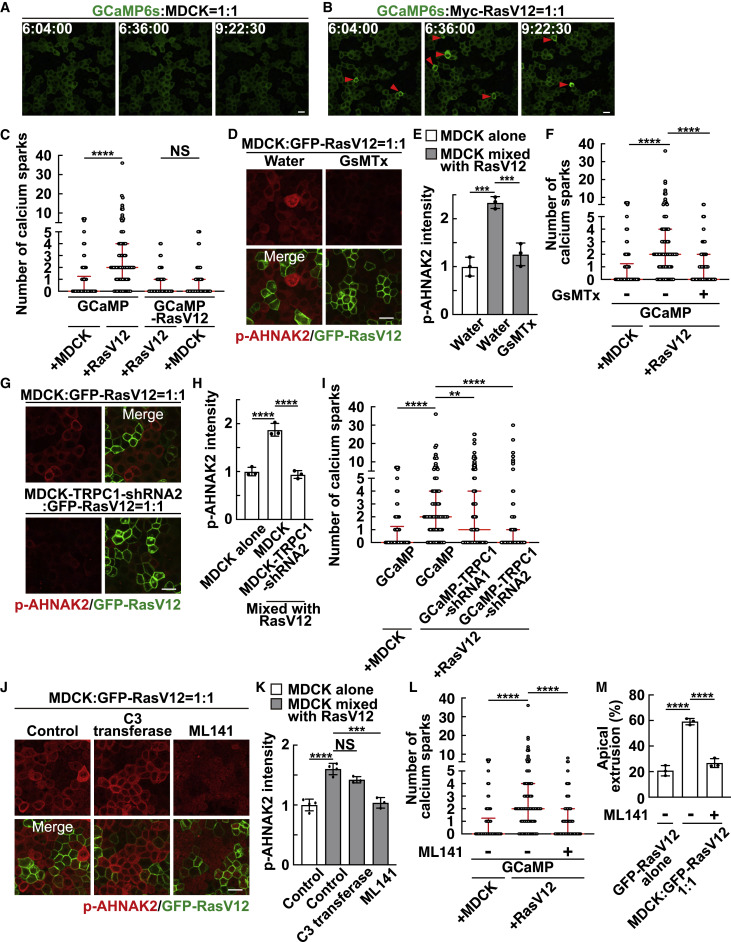
Fig. 2 Figure 2. Calcium sparks are induced in normal cells mix cultured with RasV12 cells via the mechanosensitive calcium channel TRPC1 (A and B) Time-lapse analysis of calcium sparks in GCaMP-expressing normal cells mix cultured with normal cells (A) or RasV12-transformed cells (B). Representative images extracted from time-lapse imaging of MDCK-GCaMP6s cells mix cultured with normal MDCK cells (A) or MDCK-pTRE3G Myc-RasV12 cells (B) at a ratio of 1:1 during 6–10 h after the induction of RasV12 expression. The red arrowheads indicate calcium spark-positive cells. (C) Quantification of the number of calcium sparks in MDCK-GCaMP6s cells or MDCK-pTRE3G Myc-RasV12-GCaMP6s cells mix cultured with normal MDCK or MDCK-pTRE3G Myc-RasV12 cells at a ratio of 1:1 during 6–10 h after the induction of RasV12 expression. Cumulative data from 3 (GCaMP) or 2 (GCaMP-RasV12) independent experiments are shown as medians ± IQRs (interquartile ranges). ∗∗∗∗p < 0.0001 and NS, not significant (Kruskal-Wallis test with Dunn’s test); n = 30 cells for each experiment. (D and E) Effect of the mechanosensitive calcium channel inhibitor GsMTx on AHNAK2 phosphorylation. (D) Immunofluorescence images of p-AHNAK2 (red) in the absence or presence of GsMTx. (E) Quantification of the fluorescence intensity of p-AHNAK2. Values are expressed as a ratio relative to the average of MDCK alone (water). Data are means ± SDs from 3 independent experiments. ∗∗∗p < 0.001 (1-way ANOVA with Dunnett’s test); n = 50 cells for each experiment. (F) Effect of GsMTx on the frequency of calcium sparks. Cumulative data from 3 independent experiments are shown as medians ± IQRs. ∗∗∗∗p < 0.0001 (Kruskal-Wallis test with Dunn’s test); n = 30 cells for each experiment. (G and H) Effect of TRPC1-knockdown on AHNAK2 phosphorylation. (G) Immunofluorescence images of p-AHNAK2 (red). (H) Quantification of the fluorescence intensity of p-AHNAK2. Values are expressed as a ratio relative to the average of MDCK alone. Data are means ± SDs from 3 independent experiments. ∗∗∗∗p < 0.0001 (1-way ANOVA with Dunnett’s test); n = 50 cells for each experiment. (I) Effect of TRPC1-knockdown on the frequency of calcium sparks. MDCK-GCaMP6s-TRPC1-shRNA1 or -shRNA2 cells were mix cultured with MDCK-pTRE3G Myc-RasV12 cells at a ratio of 1:1. Cumulative data from 4 (GCaMP-TRPC1-shRNA1) or 3 (the other conditions) independent experiments are shown as medians ± IQRs. ∗∗p < 0.01 and ∗∗∗∗p < 0.0001 (Kruskal-Wallis test with Dunn’s test); n = 30 cells for each experiment. (J and K) Effect of the Rho inhibitor C3 transferase or the Cdc42 inhibitor ML141 on AHNAK2 phosphorylation. (J) Immunofluorescence images of p-AHNAK2 (red) in the absence or presence of C3 transferase or ML141. (K) Quantification of the fluorescence intensity of p-AHNAK2. Values are expressed as a ratio relative to the average of MDCK alone (control). Data are means ± SDs from 4 (control) or 3 (C3 transferase and ML141) independent experiments. ∗∗∗p < 0.001, ∗∗∗∗p < 0.0001, and NS, not significant (1-way ANOVA with Dunnett’s test); n = 50 cells for each experiment. (L) Effect of ML141 on the frequency of calcium sparks. Cumulative data from 3 independent experiments are shown as medians ± IQRs. ∗∗∗∗p < 0.0001 (Kruskal-Wallis test with Dunn’s test); n = 30 cells for each experimental condition. (M) Effect of ML141 on apical extrusion of RasV12-transformed cells. At 24 h after RasV12 induction, the ratio of the apical extrusion was analyzed. Data are means ± SDs from 3 independent experiments. ∗∗∗∗p < 0.0001 (1-way ANOVA with Dunnett’s test); n > 250 cells for each experiment. (A, B, D, G, and J) Scale bars, 20 μm. See also Figure S3; Videos S1, S2, and S3.