
|
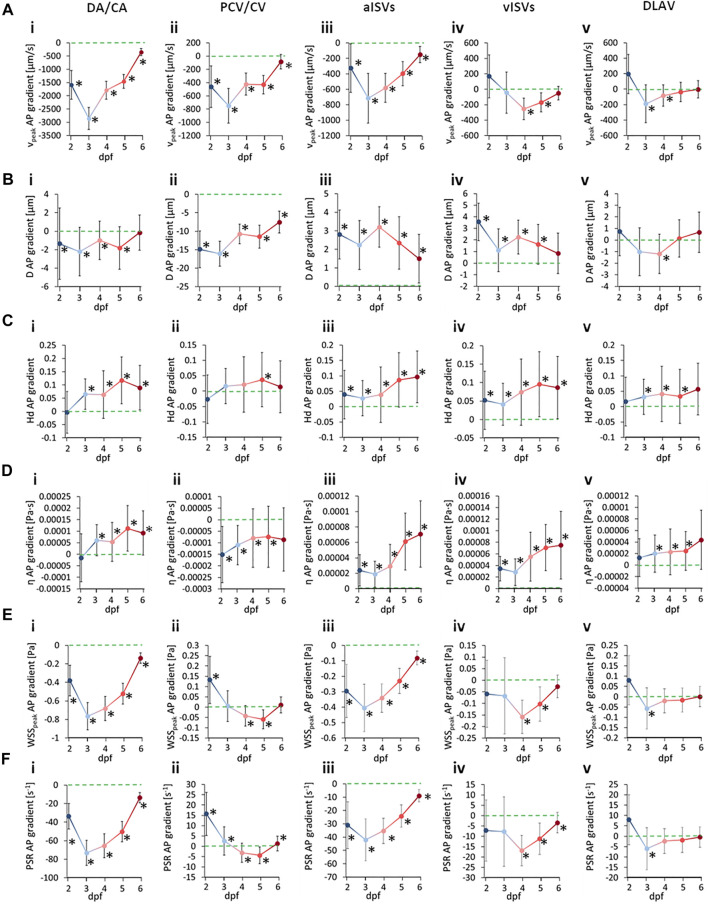
FIGURE 9
Developmental patterns of the anterior-to-posterior (AP) gradients in morphological and hemodynamic quantities in the zebrafish trunk vasculature. Circles indicate the hemodynamic AP gradient obtained from linear regression fitting of the pooled AP data, whisker bars indicate the standard error of the regression and * symbols denote statistically significant gradients from the slope T-test (