
|
Fig. 1
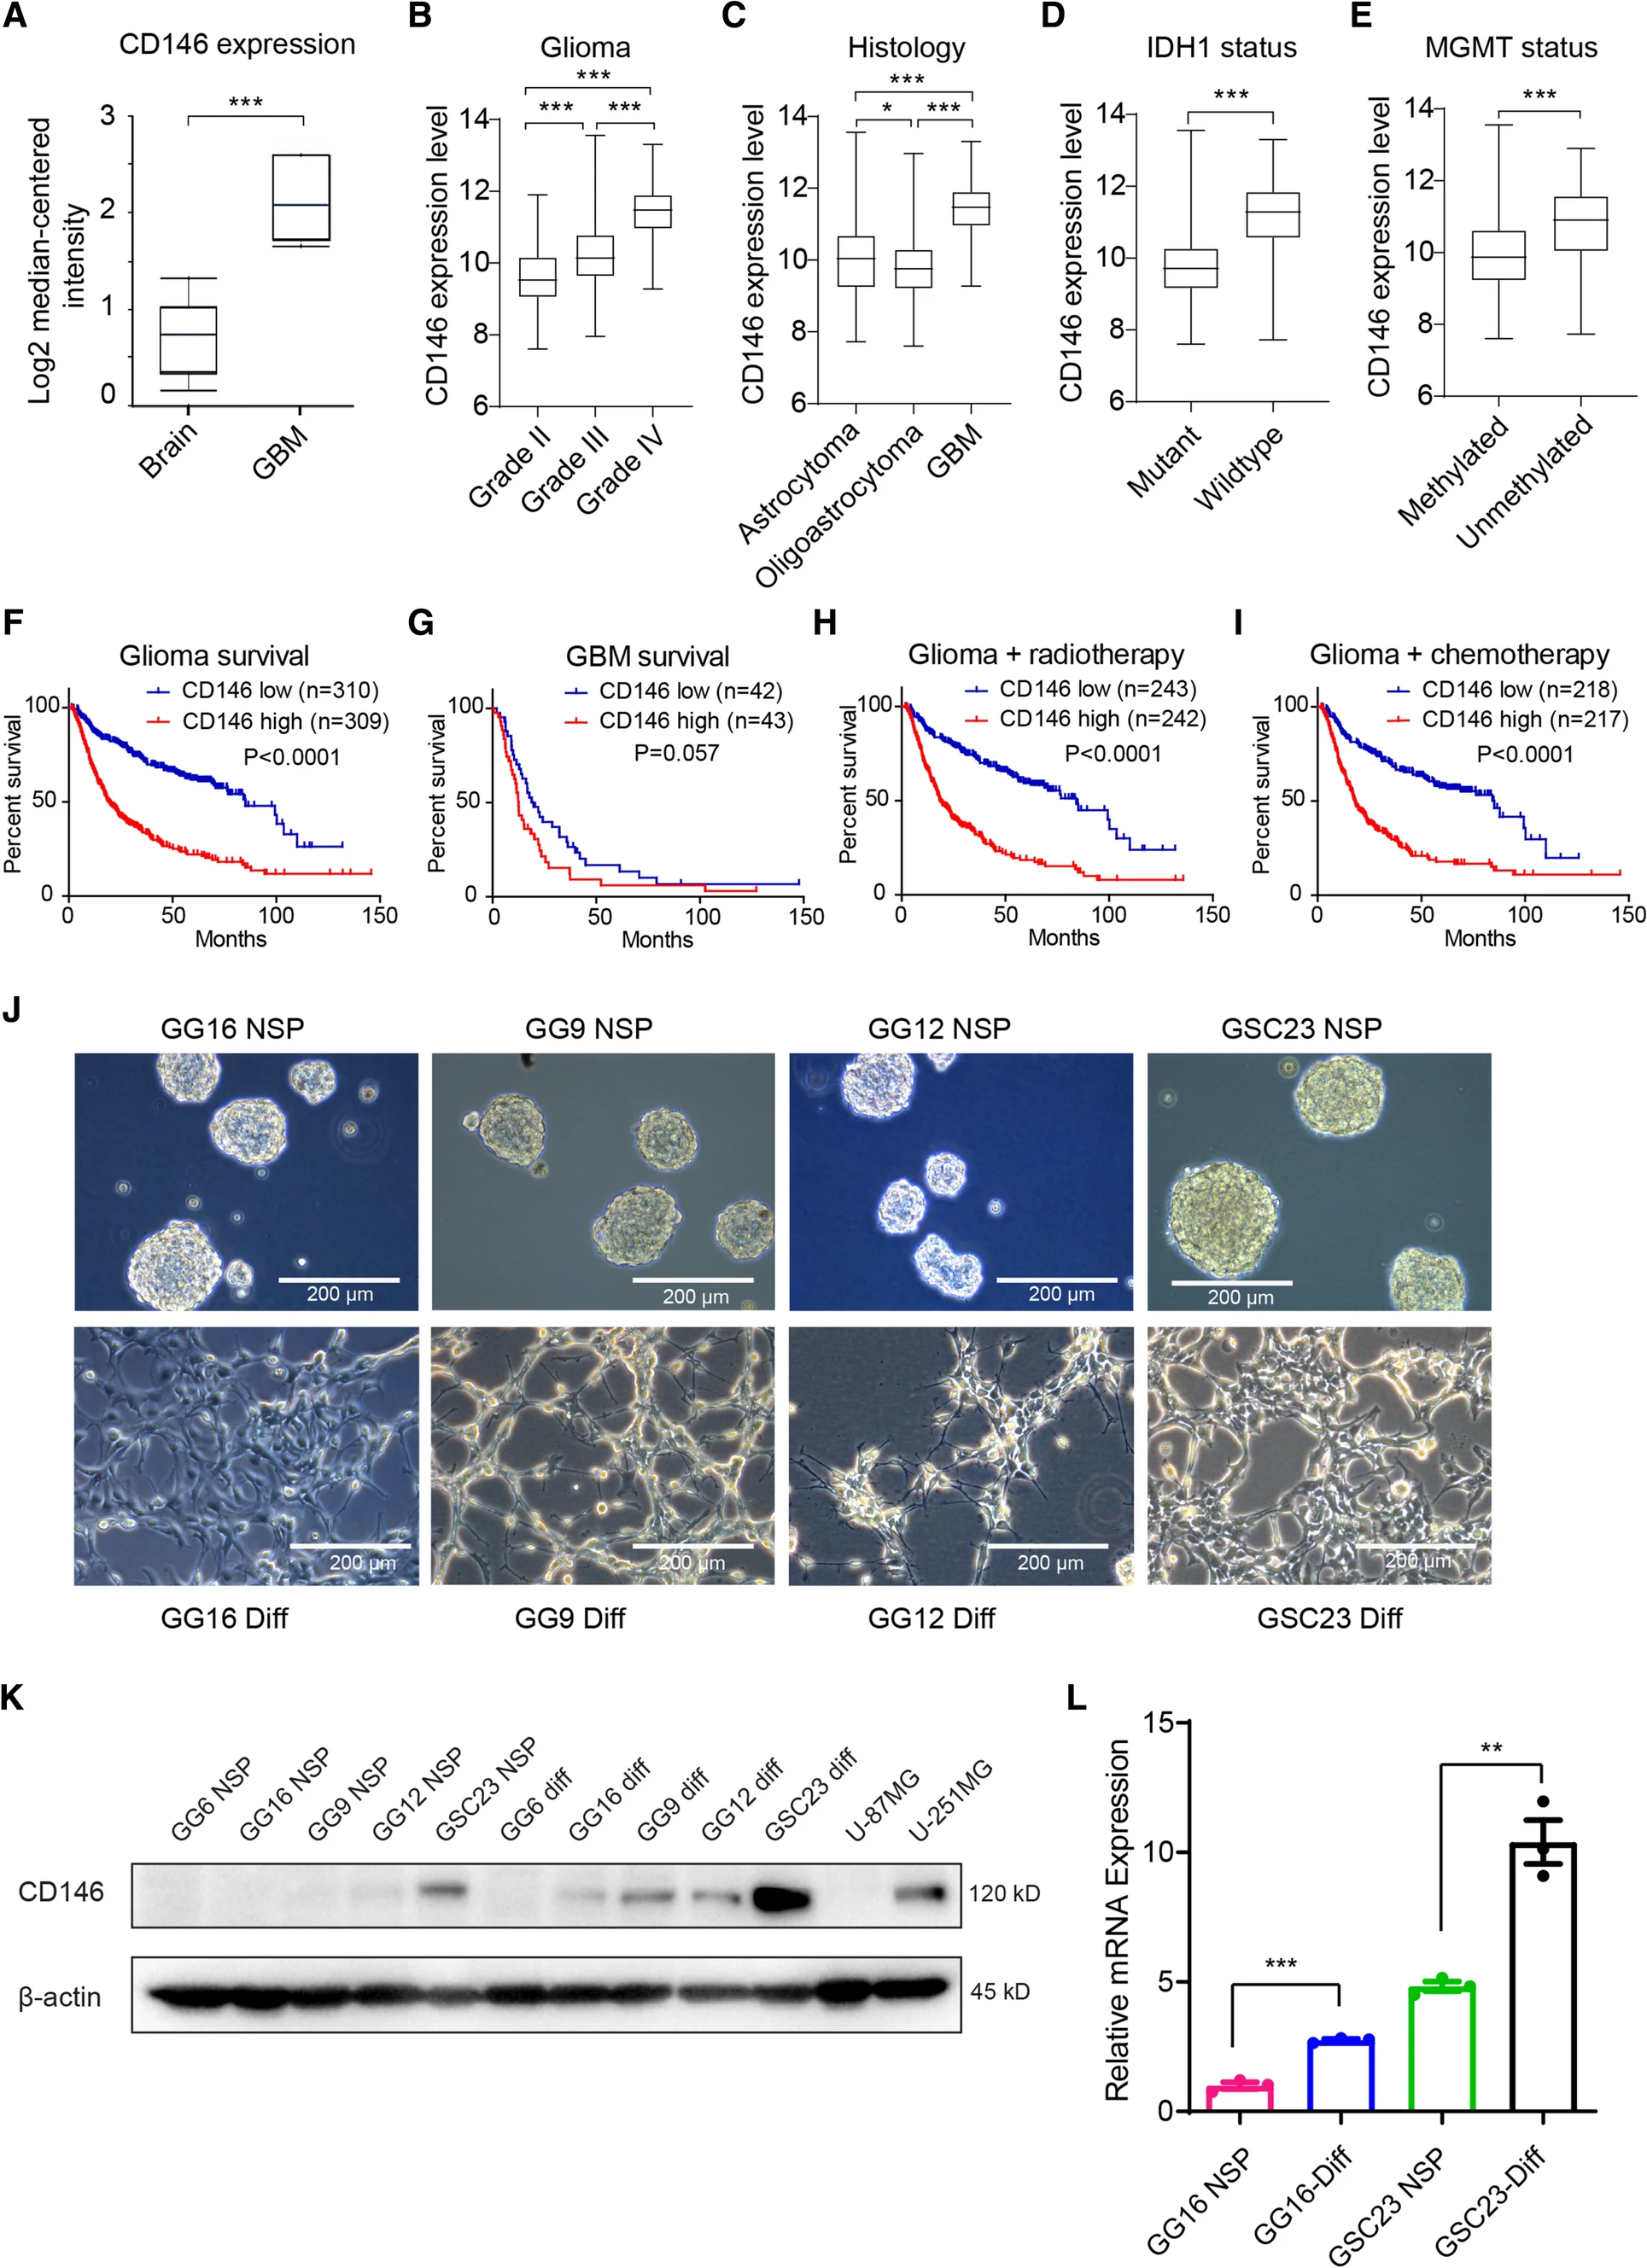
CD146 expression in glioma patients and in GBM cells. A Comparison of CD146 mRNA expression in normal human brain to GBM tissues using TCGA brain cancer database. Box plots were derived from gene expression data compared in ONCOMINE (p = 1.30E−4, fold change: 2.675). B Relative CD146 mRNA levels in grade II, grade III, and grade IV glioma; in astrocytoma, oligoastrocytoma, and GBM (C); in IDH-mutant glioma vs IDH wildtype (D); MGMT promoter methylated glioma vs the unmethylated subtype (E). F Kaplan–Meier plots derived from CGGA database showing significant differences in overall survival between low and high CD146 expression in glioma patients (G); Kaplan–Meier plot showing overall survival between low and high CD146 expression of GBM patients (H, I). Kaplan–Meier plot showing overall survival between low and high CD146 expression of glioma patients who received radiotherapy (± chemo) (H) and chemotherapy (± RT) (I). J Representative phase contrast microscopic images of indicated GBM neurospheres (NSP) cultured in serum-free medium (upper) or adherent serum-differentiated (Diff) counterparts (lower) (scale bars = 200 μm). K Western blots showing variable CD146 protein expression in GBM neurospheres that is increased upon serum differentiation. GBM cell lines U-87MG and U-251MG are also included. L Relative CD146 mRNA levels determined in by qRT-PCR in GBM neurospheres and serum-differentiated cells. Data represent the mean of triplicate experiments ± SEM, *p < 0.05; **p < 0.01; ***p < 0.001 by Student’s t test