
|
Fig. 2
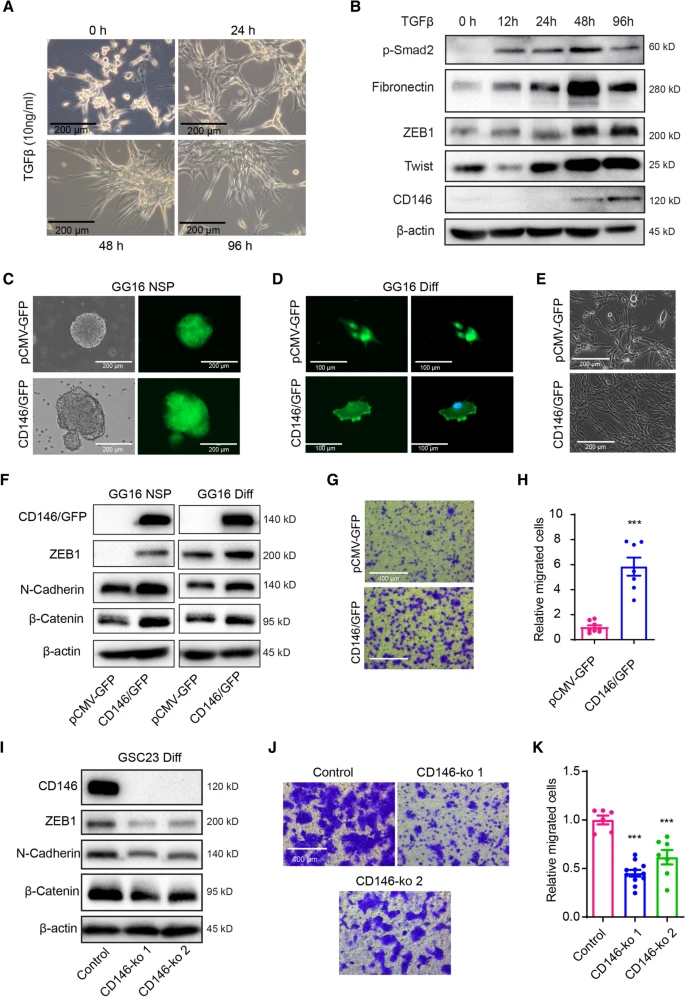
CD146 regulating mesenchymal properties in GBM cells. A Representative phase contrast microcopy images of U-87MG cells treated with TGFβ (10 ng/ml) for 0 h, 24 h, 48 h, and 96 h showing induction of a spindle-shaped, stretched out mesenchymal morphology (scale bars = 200 μm). B Western blots showing TGFβ-induced expression of p-Smad2 and mesenchymal markers Fibronectin, ZEB1, Twist1, and CD146 in U-87MG cells. C, D Phase contrast and immunofluorescent microscopic images of GG16 cells ectopically overexpressing GFP (control) or a CD146/GFP fusion protein in spheroids and serum-differentiated cells (scale bars = 200 μm). E Phase contrast microscopic images of differentiated GG16 or GG16 CD146 overexpressing cells (scale bars = 200 μm). F Overexpression of CD146/GFP in GG16 cells is accompanied by increases in ZEB1, N-cadherin, and β-catenin protein levels as measured by Western blotting. G Transwell migration assays demonstrate increased migration in CD146/GFP overexpressing GG16 cells compared to GG16-GFP control cells (scale bars = 400 μm). H Representative images of cells on Transwell membranes and quantified data are presented. Data represent the mean of triplicate experiments ± SEM, ***p < 0.001 by Student’s t test. I. Two independently generated GSC23-CD146-ko cells cultured in serum differentiation conditions have reduced expression of mesenchymal markers ZEB1, N-cadherin, and β-catenin compared to control cells as detected by Western blotting. J Representative images of Transwell migration assay membranes (scale bars = 400 μm) and K quantified data comparing GSC23 control and GSC23-CD146-ko cells, ***p < 0.001 by Student’s t test