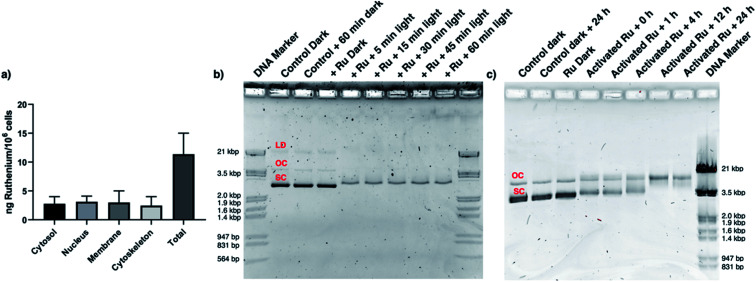
Fig. 5 [2](PF6)2 is present in the nucleus and interacts with DNA. (a) Sub-cellular distribution of ruthenium in the cytosol, nucleus, membrane, and cytoskeleton fraction of A549 cells 24 h after treatment with [2](PF6)2 (33 μM), according to ICP-MS. (b) Photo-induced binding of [2](PF6)2 to pUC19 plasmid DNA. The DNA molecular weight marker (lanes 1 & 10) correlate to 564 bp, 831 bp, 947 bp, 1.4 kbp, 1.6 kbp, 1.9 kbp, 2.0 kbp, 3.5 kbp and 21 kbp. The control pUC19 DNA band (dark) shows three bands corresponding to the linear dimer (LD), open circular (OC), and supercoiled (SC) forms. Lane 2–3 corresponds to pUC19 (control) and pUC19 incubated for 60 min in the dark. Lanes 4–9 correspond to pUC19 treated with [2](PF6)2 (40 μM) and irradiated with green light (520 nm, 21 mW cm−2) for 0 (dark), 5, 15, 30, 45, or 60 min. (c) Effect of dark incubation time on pUC19 plasmid treated with light-activated [2](PF6)2 (40 μM). The initial irradiation time was 15 min (21 mW cm−2, 19 J cm−2, 520 nm). Lanes 1–2 correspond to pUC19 (control) and pUC19 incubated for 24 h in the dark. Lane 3 corresponds to pUC19 + [2](PF6)2 without light activation. Lanes 4–8 correspond to pUC19 + [2](PF6)2 + light, followed by dark incubation times of 0, 1, 4, 12, or 24 h. Lane 9 is DNA molecular weight marker.
Image
Figure Caption
Acknowledgments
This image is the copyrighted work of the attributed author or publisher, and
ZFIN has permission only to display this image to its users.
Additional permissions should be obtained from the applicable author or publisher of the image.
Full text @ Chem Sci

