
Image
|
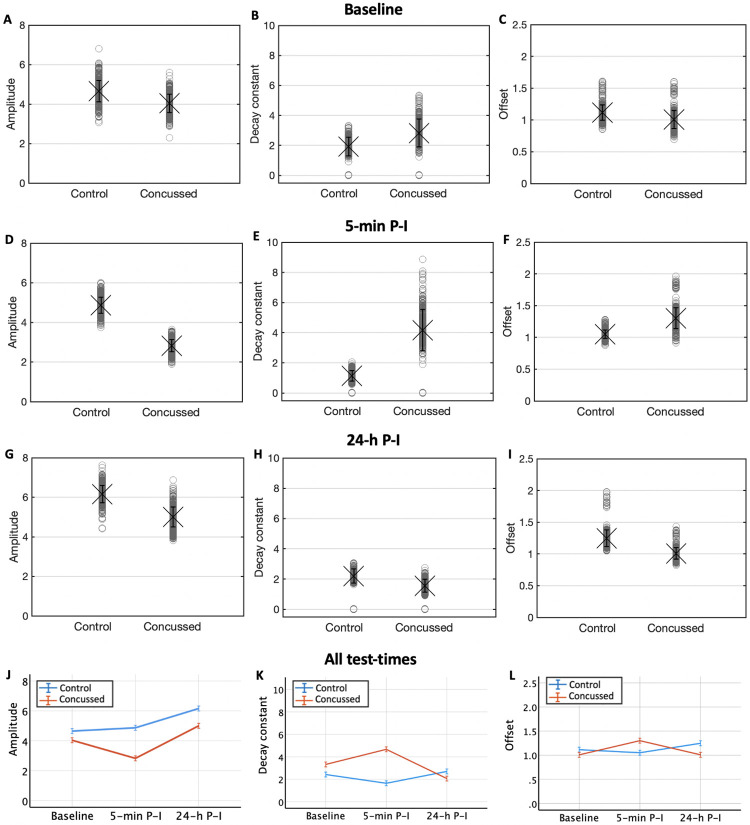
Figure Caption
Fig. 3
Population-level habituation descriptives.
Descriptive statistics for the mean (+/- 1 SE) amplitude (A, D, G), decay constant (B, E, H) and offset (C, F, I) of 500 bootstraps, for both groups (control and concussed), at baseline, 5 minutes and 24 hours P-I. Change (mean +/- 2 SE) in amplitude (J), decay constant (K) and offset (L) over the same 3 test-times.
Acknowledgments
This image is the copyrighted work of the attributed author or publisher, and
ZFIN has permission only to display this image to its users.
Additional permissions should be obtained from the applicable author or publisher of the image.
Full text @ PLoS One