
|
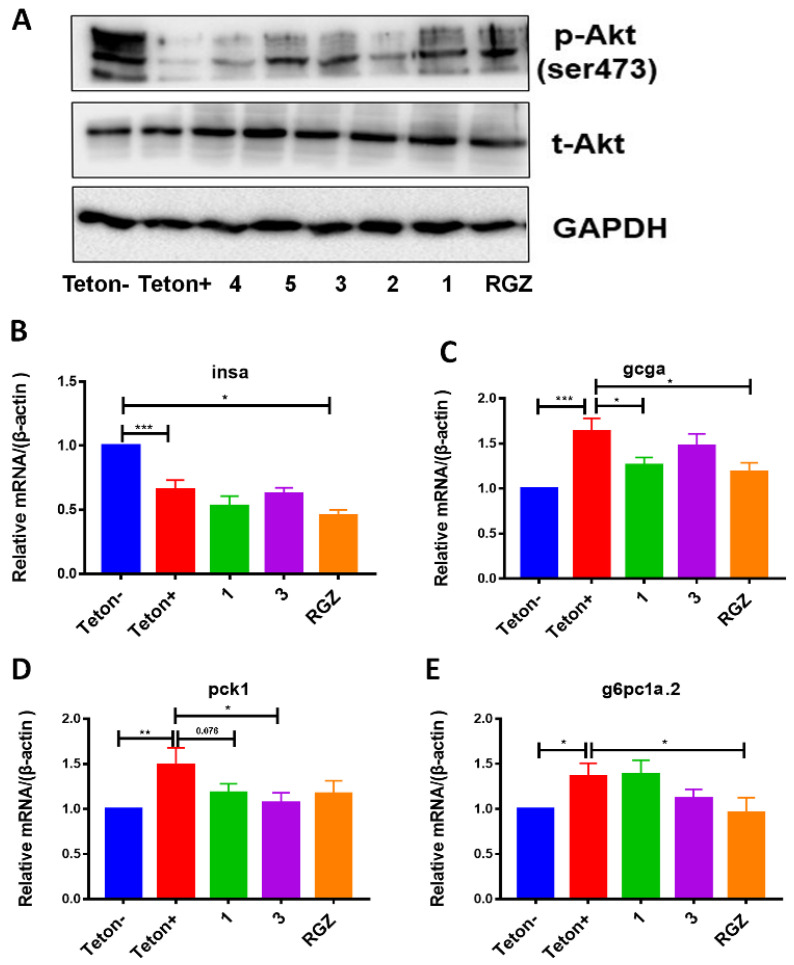
Fig. 8
Compounds 1 and 3 improved insulin sensitivity and suppressed gluconeogenesis: (A) Western blot for phosphorylated Akt (p-Akt) and total Akt (t-Akt) in ablated Tg(-1.2ins:htBidTE−ON; LR) larvae treated with or without 10 μM of compounds. GAPDH was used as an internal control. (B–E) Quantitative RT-PCR analysis of the expression of key gluconeogenic genes insa (B), gcga (C), pck1 (D), and g6pc1a.2 (E). Expression of β-actin was used as an internal control for all real-time PCR experiments. Teton−, without β-cell ablation. Teton+, β-cell ablation without compound incubation. Rosiglitazone (RGZ) was used as a control compound. All the values shown are means ± SEM from three independent experiments. * p < 0.05, ** p < 0.01, and *** p < 0.001 by one-way ANOVA.