
|
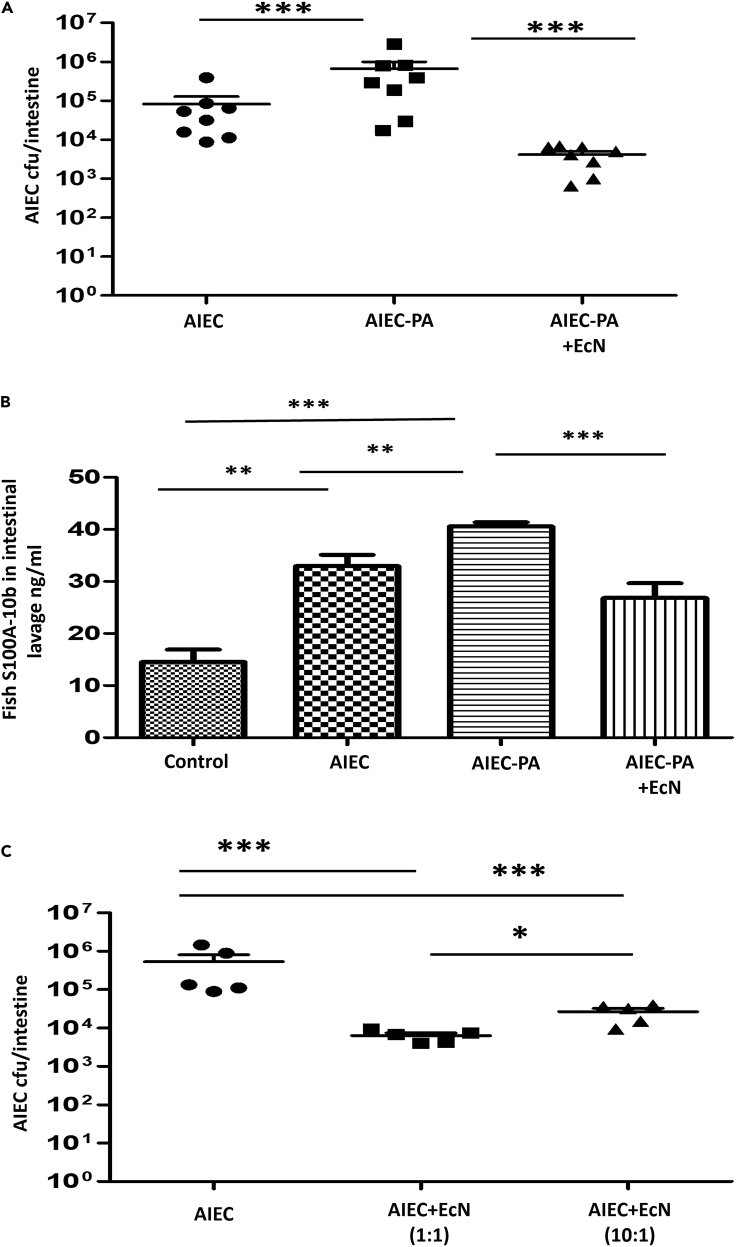
Fig. 7
EcN protects against hyperinfective AIEC
(A) Fish were added to 400 mL water containing 5 × 10⁶ CFU/mL of only AIEC, PA-primed AIEC (AIEC grown overnight in LB with 20 nM propionic acid) or a 1:1 combination of PA-primed AIEC and EcN cells for 6 h and then moved to sterile fresh water for 18 h. AIEC colonization in zebrafish intestine is shown on the y axis and is compiled from multiple experiments. Data are represented as mean +/− SEM from multiple experiments. Each dot represents the data from one fish. Total colonization per intestine was calculated after plating serial dilutions of intestinal homogenates 24 h postinfection. Statistical significance indicated above the data was determined by Student’s t test. ∗∗∗p < 0.0001.
(B) S100A-10b protein levels were determined in intestinal homogenate via calprotectin ELISA. Error bars indicate standard deviation. Data are represented as mean +/− SEM from three experiments. ∗∗p < 0.005 and ∗∗∗p < 0.0001.
(C) Fish were added to 400 mL water containing 5 × 10⁶ CFU/mL of only AIEC, 1:1 and 10:1 combination of AIEC and EcN cells for 6 h, and then incubated in fresh water for 18 h. AIEC colonization in zebrafish intestine is shown on the y axis and compiled from multiple experiments. Data are represented as mean +/− SEM from multiple experiments. Each dot represents the data from one fish. Total colonization per intestine was calculated after plating serial dilutions of intestinal homogenates 24 h postinfection. Statistical significance indicated above the data was determined by Student’s t test. ∗∗∗p < 0.0001 and ∗p = 0.0109.