
Image
|
Figure Caption
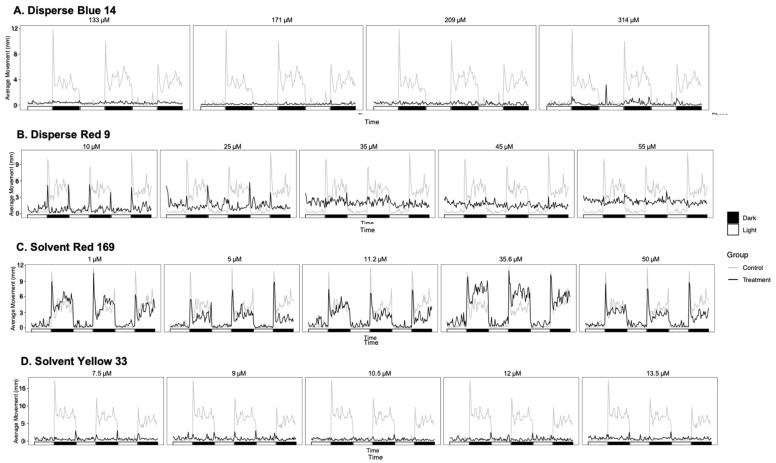
Fig. 3
Average movement of the (A) Disperse Blue 14, (B) Disperse Red 9, (C) Solvent Red 169 and (D) Solvent Yellow 33 treatment groups throughout the photomotor assay.
Acknowledgments
This image is the copyrighted work of the attributed author or publisher, and
ZFIN has permission only to display this image to its users.
Additional permissions should be obtained from the applicable author or publisher of the image.
Full text @ Toxics