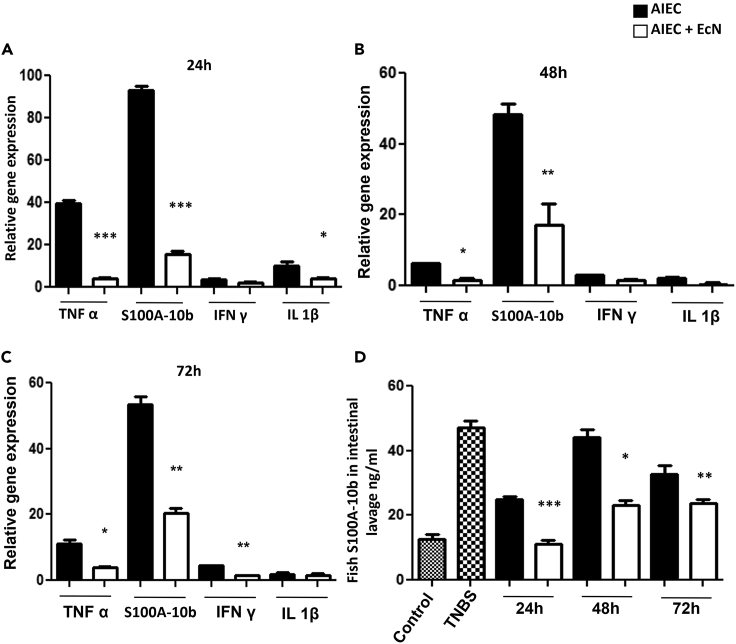
Fig. 5
Effect of EcN on AIEC-induced inflammation
(A–D) WT zebrafish were infected with 5 × 10⁶ CFU/mL AIEC and simultaneously inoculated with EcN for 6 h and then moved to fresh water for 18 h (24 hpi) (A), 42 h (48 hpi), (B) or 66 h (72 hpi) (C) and then sacrificed. mRNA was isolated from intestinal tissue. Relative gene expression levels of TNFα (A), s100a-10b (B), IFNγ (C), and IL-1β (D) were determined by qRT-PCR. Gene expression was normalized against β-actin and expressed as fold change. Error bars indicate standard deviation. Data are represented as mean +/− SEM from three experiments. ∗∗∗p < 0.0005, ∗∗p < 0.005, and ∗p < 0.05 as compared between AIEC and AIEC and EcN. (D) S100A-10b protein levels were determined in intestinal homogenates by calprotectin ELISA. Error bars indicate standard deviation. TNBS, a positive stimulator of inflammatory markers, was used as a positive control. Data are represented as mean +/– SEM from three experiments. ∗∗∗p = 0.0006, ∗∗p = 0.0025, and ∗p = 0.0412 compared between AIEC and AIEC and EcN.

