
Fig. 6
- ID
- ZDB-IMAGE-220701-30
- Publication
- Kenny et al., 2022 - TFAP2 paralogs facilitate chromatin access for MITF at pigmentation and cell proliferation genes
- All Figures
- Figures for Kenny et al., 2022
|
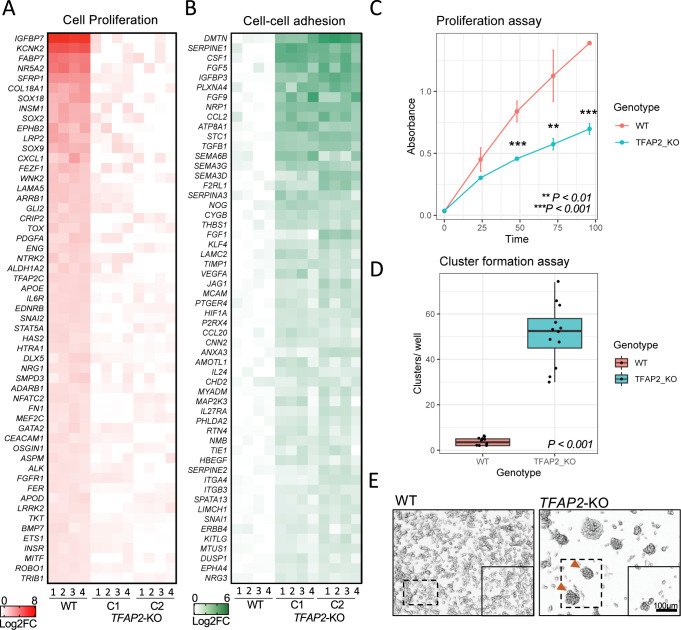
Fig. 6
(A) Heatmap representing the top 55 directly TFAP2-activated genes and (B) the top 55 directly TFAP2-inhibited genes that are associated with the GO terms cell pigmentation and cell-cell adhesion, respectively. Four replicate RNA-Seq experiments are shown for WT cells and two clones of TFAP2-KO cells (Clone 2.12 and Clone 4.3) (FDR < 0.05). (C) Growth curves (mean ± SE of mean) over 100 hours of cultivation for WT and TFAP2-KO SK-MEL-28 cells. x-axis is time and y-axis is absorbance at 450nm which is directly proportional to number of living. (D) Box plots representing the quantification of cluster formation on low-bind plates after 72 hours of culture (n = 12 independent experiments, p < 0.001 by Student’s t-test, plot shows mean ± SD). (E) Representative images of clusters formed in WT and TFAP2-KO cells after 72 hours.