
|
Fig. 5
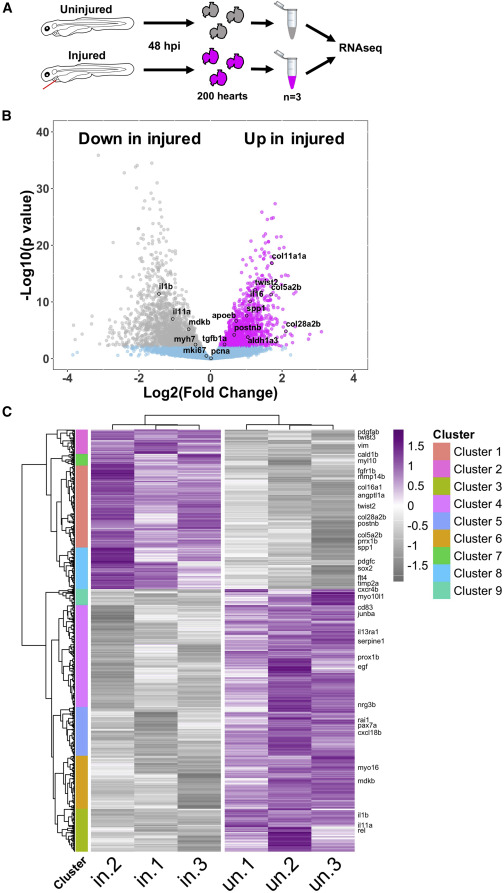
Figure 5. Bulk RNA-seq analysis of larval hearts following injury (A) Extraction of uninjured and injured hearts at 48 hpi and the pooling of 200 hearts per biological replicate for RNA-seq, n = 3. (B) Volcano plot showing the log2(fold change) and –log10(p value) for transcripts of each detected gene. Genes whose adjusted p values fall below 0.05 are deemed statistically non-significant and colored blue. Genes up regulated in injured hearts are colored magenta and those upregulated in uninjured hearts are colored gray. (C) Heatmap displaying statistically significantly differentially expressed genes with a log2(fold change) >0.5. Genes were hierarchically clustered by Pearson correlation with z scaling. Clusters are indicated on the left with their dendrogram. Magenta, high expression; gray, low expression. Genes with relevance to cardiac regeneration are highlighted as annotations on the right of the plot, n = 3.
Reprinted from Developmental Cell, 57(12), Bruton, F.A., Kaveh, A., Ross-Stewart, K.M., Matrone, G., Oremek, M.E.M., Solomonidis, E.G., Tucker, C.S., Mullins, J.J., Lucas, C.D., Brittan, M., Taylor, J.M., Rossi, A.G., Denvir, M.A., Macrophages trigger cardiomyocyte proliferation by increasing epicardial vegfaa expression during larval zebrafish heart regeneration, 1512-1528.e5, Copyright (2022) with permission from Elsevier. Full text @ Dev. Cell