
IMAGE
Fig. 7
- ID
- ZDB-IMAGE-220629-78
- Publication
- Wang et al., 2020 - RNA-based therapies in animal models of Leber congenital amaurosis causing blindness
- All Figures
- Figures for Wang et al., 2020
Image
|
Figure Caption
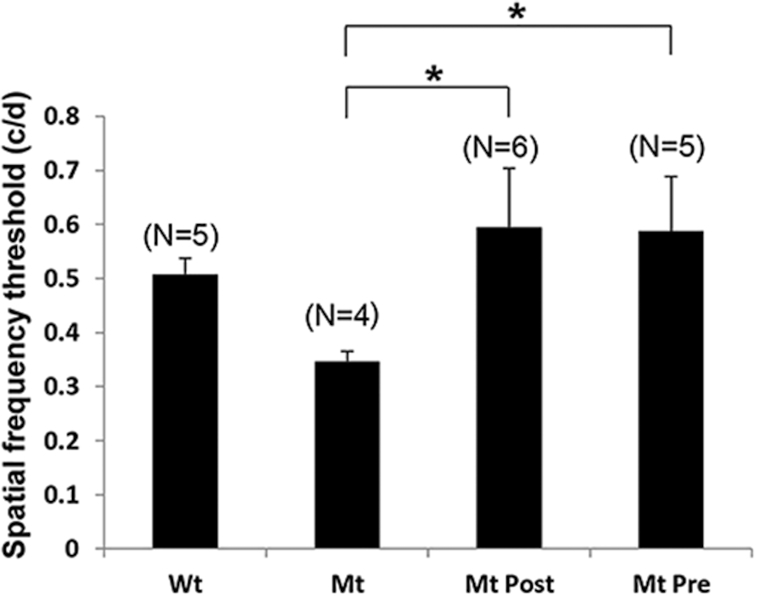
Fig. 7
Behavioral optokinetic tracking (OKT) assessments in Rd12 mice (Mt) compared to wildtype mice (Wt). Spatial frequency threshold measured in cycles/degree (c/d) for Wt mice, untreated Mt mice, Mt treated postnatally (Mt Post), and Mt treated prenatally plus postnatal treatment (Mt Pre). Data plotted as mean ± SEM, number mice per group in parentheses. *P < 0.001.
Acknowledgments
This image is the copyrighted work of the attributed author or publisher, and
ZFIN has permission only to display this image to its users.
Additional permissions should be obtained from the applicable author or publisher of the image.
Full text @ Precis Clin Med