
Image
|
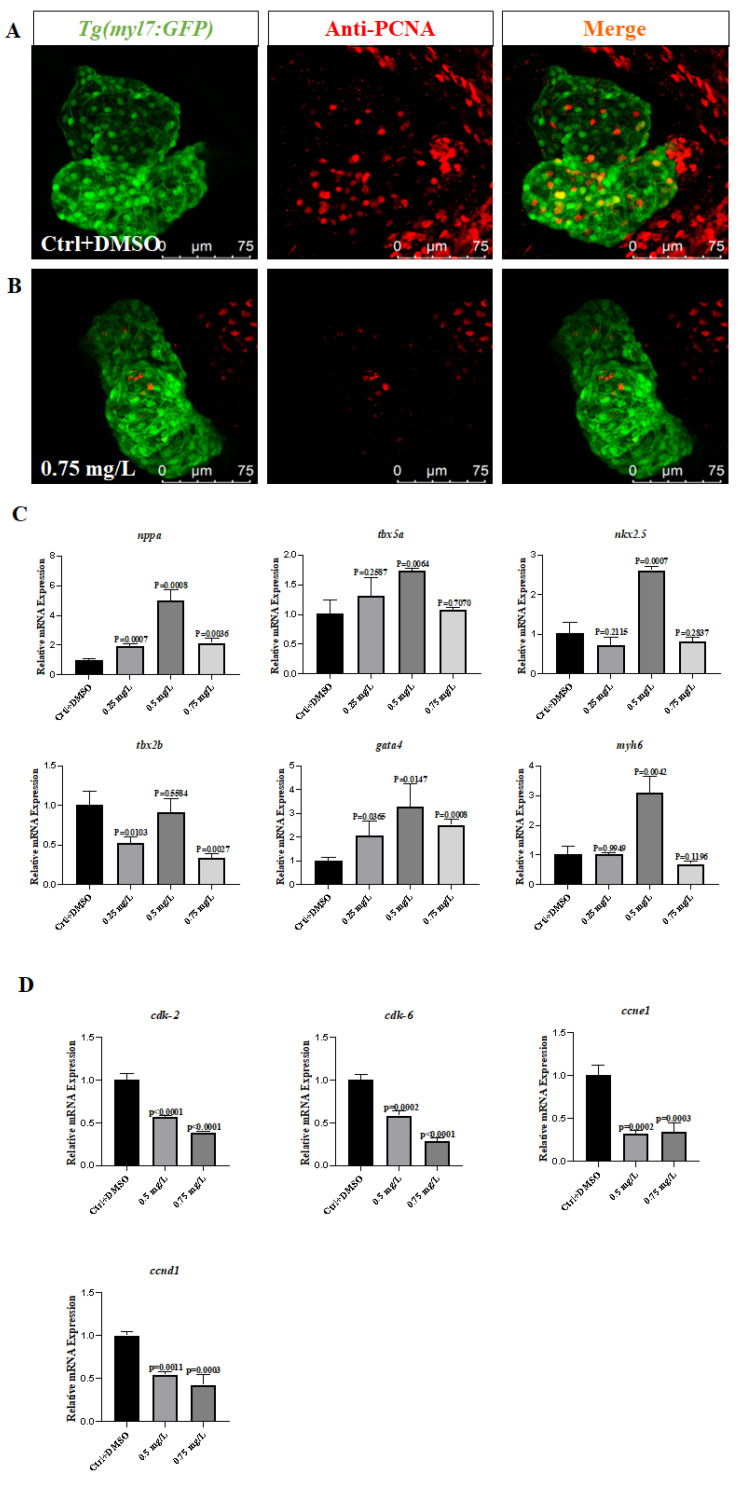
Figure Caption
Fig. 3
Pentachloronitrobenzene inhibited cardiac proliferation. (A). Cardiac proliferation in the Ctrl group (orange represents proliferating cells). (B). Cardiac proliferation in the 0.75 mg/L treatment group. (C). Expression levels of heart-related genes. (D). Cell proliferation-related gene expression. Each difference is a comparison between the control group and the treatment group. (n = 20, Means ± SD).
Acknowledgments
This image is the copyrighted work of the attributed author or publisher, and
ZFIN has permission only to display this image to its users.
Additional permissions should be obtained from the applicable author or publisher of the image.
Full text @ Toxics