
Image
|
Figure Caption
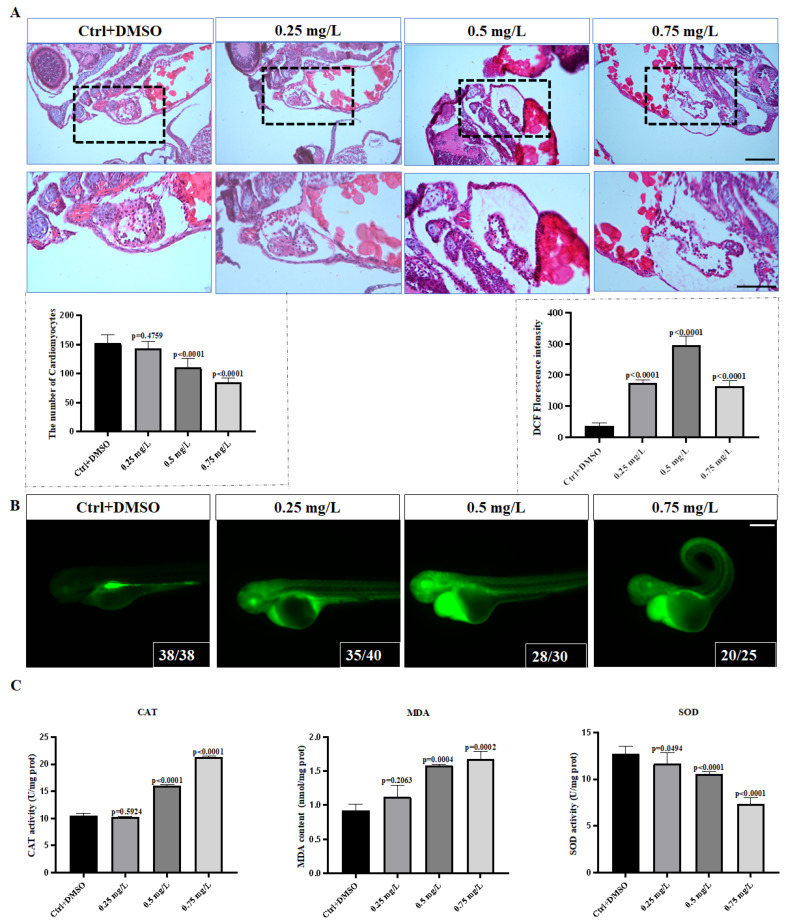
Fig. 2
Hematoxylin-Eosin staining image and PCNB causes oxidative stress in the body. (A). Comparison of H&E staining in the control group and H&E staining in the PCNB treatment group. (B). Reactive oxygen species staining images of different treatment groups. (C). Malondialdehyde content, CAT activity, and SOD activity. Each difference is a comparison between the control group and the treatment group. (n = 3, Means ± SD. Scale bar: (A) 50 μm/25 μm. (B) 300 μm).
Acknowledgments
This image is the copyrighted work of the attributed author or publisher, and
ZFIN has permission only to display this image to its users.
Additional permissions should be obtained from the applicable author or publisher of the image.
Full text @ Toxics