
Image
|
Figure Caption
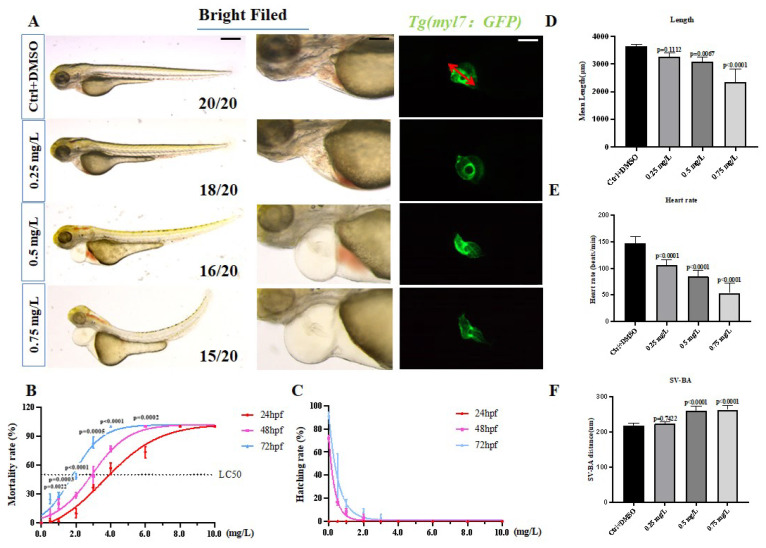
Fig. 1
The phenotype of embryos treated with PBCN. (A). Bright field images of the whole body and heart and fluorescence microscope images of the heart. (B,C). Under different concentrations of PCNB, 24, 48, 72 hpf, the survival rate and hatching rate of embryos. (D–F). A statistical graph of the embryo’s body length, heart rate, and atrioventricular distance after 72 h of treatment with different concentrations. SV-BA refers to the distance from the atrium to the ventricle, the red arrow in the figure points. (n = 3, Means ± SD. Scale bar: 500 μm/100 μm).
Acknowledgments
This image is the copyrighted work of the attributed author or publisher, and
ZFIN has permission only to display this image to its users.
Additional permissions should be obtained from the applicable author or publisher of the image.
Full text @ Toxics