
Fig. 6
- ID
- ZDB-IMAGE-220628-45
- Genes
- Antibodies
- Publication
- Wiltbank et al., 2022 - Cd59 and inflammation regulate Schwann cell development
- All Figures
- Figures for Wiltbank et al., 2022
|
Fig. 6
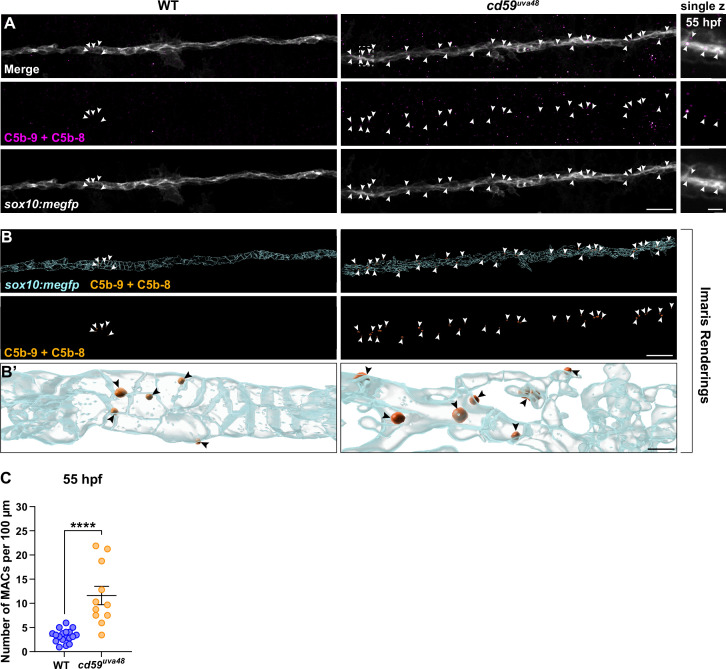
(A) Top panel: immunofluorescence (IF) showing MACs (C5b-9+C5b-8; magenta, indicated with white arrows) embedded in sox10:megfp-positive posterior lateral line nerve (pLLN) SC membranes (gray) at 55 hours post fertilization (hpf). White dotted box corresponds with inset of a single z-plane on the right showing that MACs are within SC membranes. (B) Imaris renderings showing MACs (C5b-9+C5b-8; orange, indicated with white arrows) embedded in sox10:megfp-positive pLLN SC membranes (cyan) at 55 hpf. (B’) Enlarged renderings show MAC puncta (orange, indicated with black arrows) embedded in the SC membranes (cyan). (C) Scatter plot of the number of MACs in SC membranes at 55 hpf (mean ± SEM: WT: 3.3 ± 0.3, cd59uva48: 11.6 ± 1.9; p<0.0001; dot = 1 fish). These data were compared with Student’s t-test using GraphPad Prism. All data were normalized to units per 100 µm. All images were acquired with confocal imaging. Scale bars: (A, B) 10 µm; inset (A) and enlarged renderings (B’), 5 µm.