
Fig. 5
- ID
- ZDB-IMAGE-220628-44
- Genes
- Antibodies
- Publication
- Wiltbank et al., 2022 - Cd59 and inflammation regulate Schwann cell development
- All Figures
- Figures for Wiltbank et al., 2022
|
Fig. 5
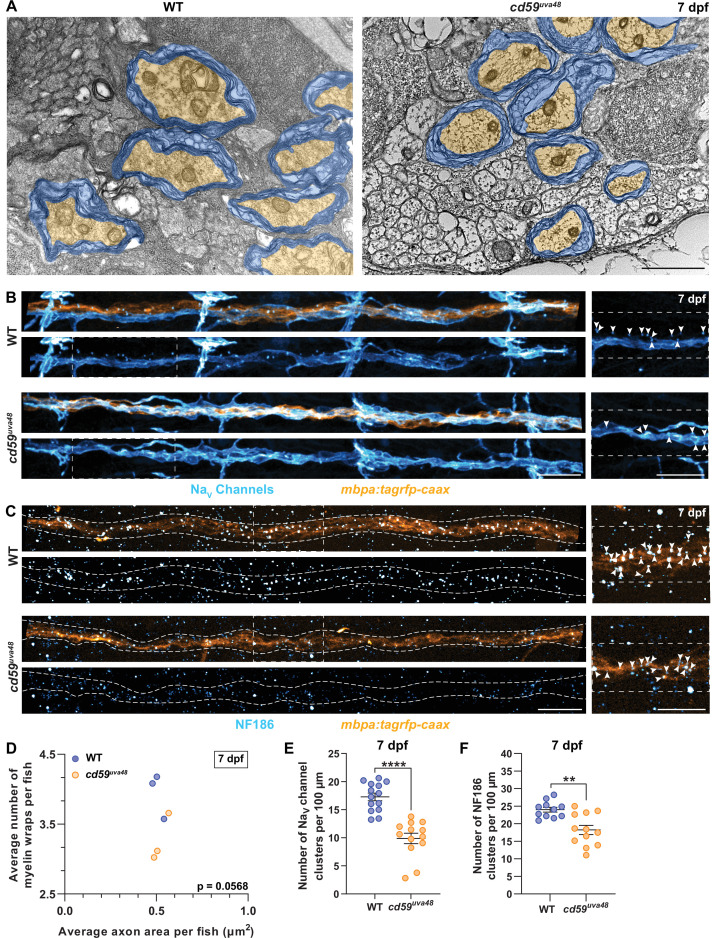
(A) Transmission electron micrographs showing posterior lateral line nerve (pLLN) axons myelinated by Schwann cells (SCs) at 7 days post fertilization (dpf). Myelin is shaded in blue, and myelinated axons are shaded in orange. (B) Immunofluorescence (IF) showing NaV channels (cyan) along mbpa:tagrfp-caax-positive pLLNs (orange) at 7 dpf. Diffuse NaV channel staining along unmyelinated nerves was not quantified. White dashed lines outline the pLLN. White dashed boxes correspond with the insets on the right. (C) IF showing NF186 clusters (cyan) along mbpa:tagrfp-caax-positive pLLNs (orange) at 7 dpf. White dashed lines outline the pLLN, and the white dashed boxes correspond to the insets on the right. Representative images in (B) and (C) depict somites 11–13 (~320 µm). (D) Average number of myelin wrappings per pLLN axon plotted relative to the average area of axon cross-section at 7 dpf. Data were collected from three sections per fish separated by 100 µm. Significance was determined by comparing the average number of myelin wraps divided by the average axon area for each fish with Student’s t-test using GraphPad Prism (average number of myelin wraps per fish mean ± SEM: WT: 3.95 ± 0.19, cd59uva48: 3.27 ± 0.20; average axon area per fish mean ± SEM: WT: 0.51 ± 0.03, cd59uva48: 0.52 ± 0.03; average number of myelin wraps/average axon area per fish mean ± SEM: WT: 0.13 ± 0.01, cd59uva48: 0.16 ± 0.002; p=0.0568; dot = 1 fish). Data quantified in (D) were determined from electron micrographs in (A). (E) Scatter plot of the number of NaV channel clusters along mbpa:tagrfp-positive pLLN nerves at 7 dpf (mean ± SEM: WT: 17.3 ± 0.7, cd59uva48: 9.9 ± 0.9; p<0.0001; dot = 1 fish). (F) Scatter plot of the number of NF186 clusters along mbpa:tagrfp-positive pLLN nerves at 7 dpf (mean ± SEM: WT: 24.0 ± 0.7, cd59uva48: 18.2 ± 1.3; p=0.0011; dot = 1 fish). Data were collected from somites 3–13 (~320 µm) and normalized to units per 100 µm for (E) and (F). Images shown in (A) were acquired with transmission electron microscopy. Images shown in (B) and (C) were acquired with confocal imaging. Each dataset was compared with Student’s t-test using GraphPad Prism. Scale bars: (A) 1 µm; (B, C) 25 µm.