
Image
|
Figure Caption
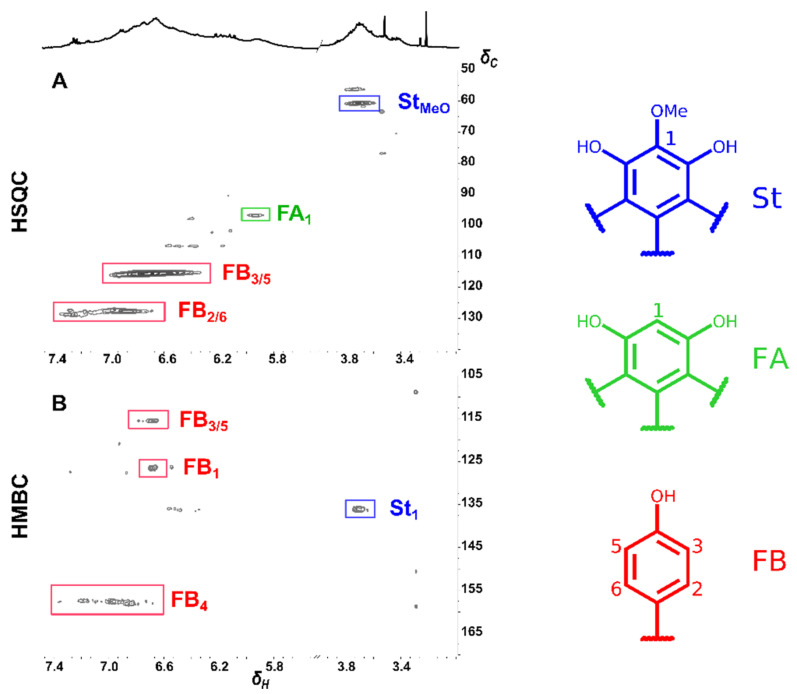
Fig. 2
2D-HSQC- (A) and 2D-HMBC-NMR (B) spectra (in acetone-d6:D2O, 7:3) of the polymeric fraction (YS poly) isolated from Y. schidigera cortex. Top black trace: 1H NMR spectrum of YS poly.
Acknowledgments
This image is the copyrighted work of the attributed author or publisher, and
ZFIN has permission only to display this image to its users.
Additional permissions should be obtained from the applicable author or publisher of the image.
Full text @ Molecules