
Fig. 2
- ID
- ZDB-IMAGE-220628-155
- Publication
- Bortolin-Cavaillé et al., 2022 - Probing small ribosomal subunit RNA helix 45 acetylation across eukaryotic evolution
- All Figures
- Figures for Bortolin-Cavaillé et al., 2022
|
Fig. 2
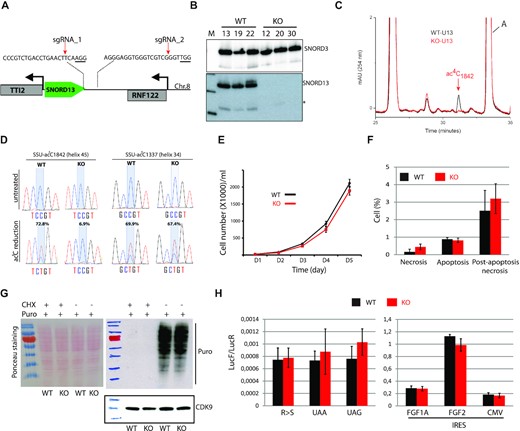
The specific lack of SNORD13-mediated acetylation in helix 45 does not alter cell growth or translation. (A) Schematic representation of SNORD13 locus at human chromosome 8. The relative location of the two DNA sequences targeted by sgRNAs is shown (PAM sequence is underlined). (B) Northern blot showing that SNORD13 is no longer detected in clones bearing deletions. * indicates truncated SNORD13 form which is routinely detected and corresponding to RNA species whose 5′-end is positioned 5–6 nucleotides upstream of the C-box (not shown). (C) RP-HPLC chromatograms of nucleosides obtained from helix 45 of WT (black) and SNORD13-KO (red) cells. Peak corresponding to SSU-ac4C1842 is indicated. (D) Sanger DNA sequencing of RT-PCR products obtained after borohydride treatments of total RNA extracted from WT and SNORD13-KO cells. Percentage of misincorporation (C-to-U) at SSU-C1842 (helix 45) and SSU-C1337 (helix 34) is indicated above each electropherogram. (E) Growth curves of WT and SNORD13-KO cells as judged by cell counting (n = 6 for each genotype). (F) Apoptosis levels determined by flow cytometry using propidium and Annexin V staining of WT and SNORD13-KO cells (n = 2 for each genotype). (G) SUnSET assay. Incorporation of puromycin into the elongating peptide was assayed in WT and SNORD13-KO cells (western blotting with anti-puromycin antibodies). Ponceau S staining of the membrane and detection of CDK9 (western blotting) were used as gel loading controls. Cells treated with the translation inhibitor cycloheximide (CHX) were also used as negative controls. (H) Luciferase reporter gene assays. WT and SNORD13-KO cells were transiently co-transfected by two plasmids expressing Renilla luciferase gene (LucR; internal control) or Firefly luciferase gene (lucF; translation reporter) carrying either an in-frame stop-codons (UAA, UAG), a detrimental mutation (R-to-S) or an IRES from FGF1A, FGF2 and CMV. Histograms show the normalized luciferase activity (lucF-to-lucR ratio). Data are expressed as mean ± s.e.m. and represent 5–6 independent experiments with triplicate measurements.