
|
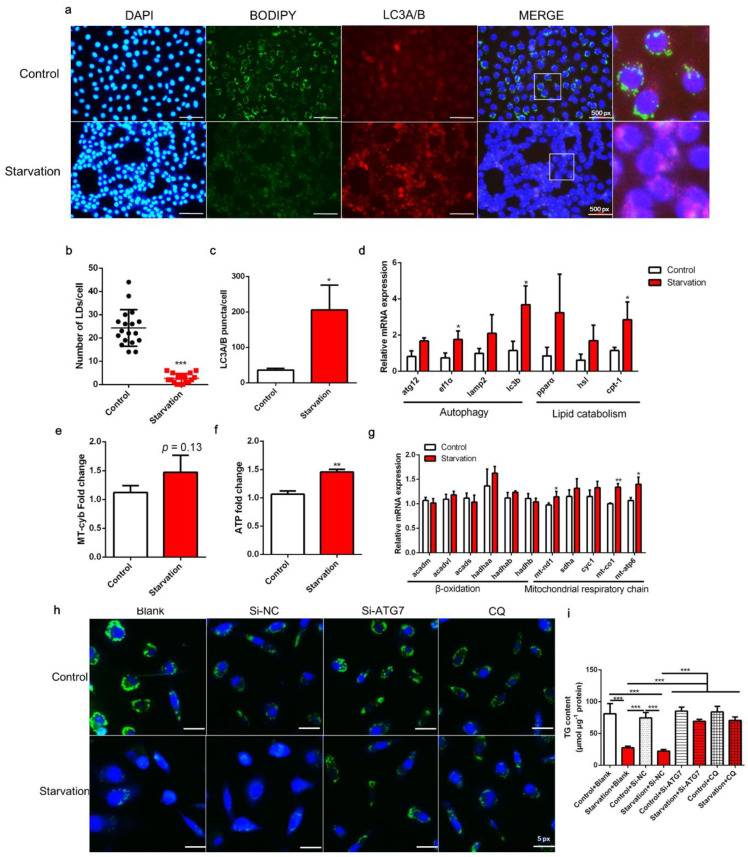
Fig. 1
Effects of serum starvation on lipid droplet (LD) accumulation, autophagy, and mitochondrial energy production in zebrafish liver cells. Cells were incubated with either normal medium or serum-free medium for 24 h (a–g). (a) LDs were stained with BODIPY (green); nuclei were stained with DAPI (blue); and LC3A/B was stained with a specific immunofluorescent antibody (red). (b) LDs in 18 cells (6 cells in each image) were quantified using ImageJ. (c) Relative fluorescence puncta of LC3A/B per cell were quantified using ImageJ (n = 3). (d) Relative transcript expression of autophagy- and lipid catabolism-related genes (n = 3). (e) Mitochondrial copy number (n = 4). (f) ATP level (n = 6). (g) Relative transcript expression of β-oxidation- and mitochondrial respiratory chain-related genes (n = 3). (h,i) Cells were pre-treated with siRNA against negative control (NC), ATG7, or CQ and then serum-starved for 24 h. LDs were stained with BODIPY, and the TG content was measured (n = 4). atg12, autophagy-related 12; ef1α, elongation factor 1 α; lamp2, lysosomal-associated membrane protein 2; lc3b, microtubule-associated protein 1 light chain 3b; atgl, adipose tissue lipase; hsl, hormone-sensitive lipase; cpt-1, carnitine palmitoyltransferase 1; acadm, acyl-CoA dehydrogenase medium chain; acadvl, acyl-CoA dehydrogenase very long chain; acads, acyl-CoA dehydrogenase short chain; hadh, hydroxyacyl-CoA dehydrogenase trifunctional multienzyme complex; mt-nd1, NADH dehydrogenase 1, mitochondrial; sdha: succinate dehydrogenase complex, subunit A; cyc1: cytochrome c-1; mt-co1: mitochondrial cytochrome c oxidase; mt-atp: mitochondrial ATP synthase. Statistical significance is denoted with asterisks as follows: * p < 0.05; ** p < 0.01; *** p < 0.001.