
Image
|
Figure Caption
Fig. 6
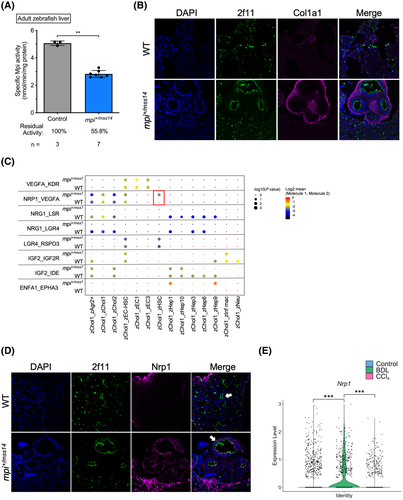
Identifying key alterations in Mpi-depleted cholangiocytes. (A) Bar graph showing Mpi enzymatic activity in WT and mpi+/mss14 adult zebrafish livers. (B) Immunofluorescent staining for 2f11 and Col1a1 on WT and mpi+/mss14 adult zebrafish liver cryosections imaged at magnification ×63. (C) Dot plot of receptor–ligand interaction scores determined by CellPhoneDB analysis of scRNA-seq gene expression in WT and mpi+/mss7 zebrafish liver cells. Dot color indicates log2(mean expression score) with values closest to zero indicating the highest expression score. −Log10(p value) is represented by dot size, with increasing dot size indicating increasing significance. (D) Immunofluorescent staining for 2f11 and Nrp1 on WT and mpi+/mss14 adult zebrafish liver cryosections imaged at magnification ×63. White arrows indicate representative bile ducts for each sample. (E) Violin plot for Nrp1 expression in Sox9+ cholangiocytes from scRNA-seq data on livers from control, BDL, and CCl4-treated mice. **p < 0.01, ***p < 0.001
Figure Data
Acknowledgments
This image is the copyrighted work of the attributed author or publisher, and
ZFIN has permission only to display this image to its users.
Additional permissions should be obtained from the applicable author or publisher of the image.
Full text @ Hepatol Commun