IMAGE

FIGURE 6

ID
ZDB-IMAGE-220625-17
Source
Figures for Green et al., 2022
Image
Figure Caption

FIGURE 6

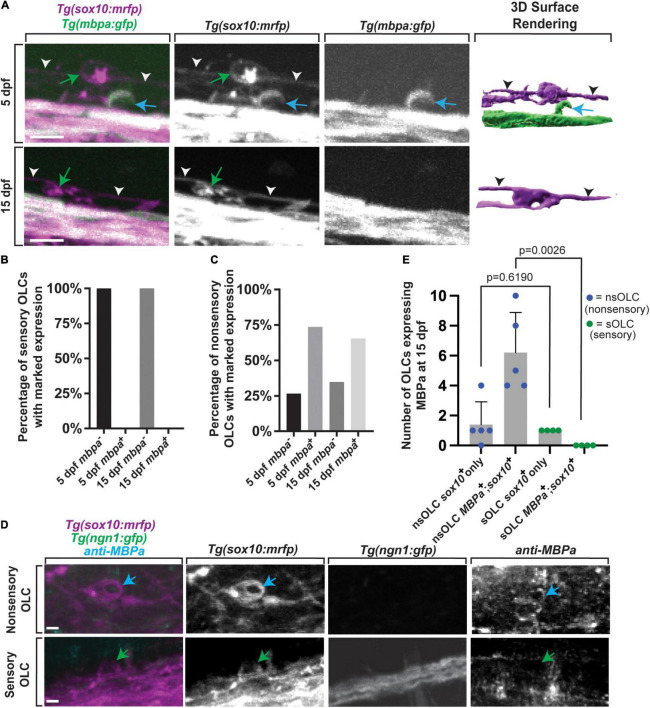
Sensory-related OLCs do not express typical OLC mbpa expression. (A) Confocal z-stack still images of Tg(mbpa:gfp);Tg(sox10:mrfp) animals at 5 and 15 dpf showing the lack of mbpa+ expression in sensory oligodendrocytes. Blue arrows represent non-sensory-related OLCs. Green arrows represent sensory-related OLCs. White and black arrowheads indicate sensory axons. (B) Quantification of the percentage of mbpa;sox10+ and mbpa+;sox10+ sensory OLs at 5 and 15 dpf. (C) Quantification of the percentage of mbpa;sox10+ and mbpa+;sox10+ non-sensory OLs at 5 and 15 dpf. (D) Confocal z-stack still images of Tg(sox10:mrfp);Tg(ngn1:gfp) animals at 15 dpf stained with an anti-MBPa antibody showing the lack of anti-MBPa in sensory-related OLCs. Blue arrows represent non-sensory-related OLCs and green arrows represent sensory-related OLCs. (E) Quantification of the number of non-sensory-related OLCs (nsOLCs) and sensory-related OLCs (sOLCs) expressing sox10+ only or at 15 dpf. Scale bar equals 10 μm (A,E). All images are orientated anterior to left, posterior to right, dorsal up and ventral down.

Acknowledgments
This image is the copyrighted work of the attributed author or publisher, and ZFIN has permission only to display this image to its users. Additional permissions should be obtained from the applicable author or publisher of the image. Full text @ Front. Cell. Neurosci.