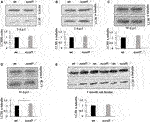
Fig. 10
FIGURE 10. LC3-II protein levels as an indicator of autophagosome formation and flux. Western blotting was performed in larvae of different ages (3, 5, 10, and 15 d.p.f.) and on brains of adult zebrafish to measure the levels of LC3-II as a measure of autophagosome number. No differences in LC3-II levels were observed between wildtype (wt) and sumf1−/− fish at 3 d.p.f., 5 d. p.f., 10 d.p.f. Although a modest increase (1.28x) increase in LC3-II was observed at 15 d.p.f. this difference was not evident in the brains of adult fish (7 months). Graphs show mean values (±SEM) of densitometry of LC3-II normalised to β-actin (loading control at 3 d.p.f) and α-tubulin (loading control at 5 d.p.f., 10 d.p.f., 15 d.p.f. and 7 months) from at least 3 independent experiments. Statistical analysis was performed using a two-tailed t-test. *p < 0.05.

