
Fig. 8
- ID
- ZDB-IMAGE-220622-35
- Publication
- Fleming et al., 2022 - Unexpected Phenotype Reversion and Survival in a Zebrafish Model of Multiple Sulfatase Deficiency
- All Figures
- Figures for Fleming et al., 2022
|
Fig. 8
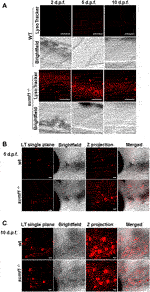
FIGURE 8. Imaging of lysosomes. In vivo lysotracker staining was imaged using confocal microscopy. (A) A striking increase in lysotracker staining was observed in the spinal cord of sumf1−/− larvae compared to wildtype (wt) larvae at 2 d.p.f., 5 d.p.f., and 10 d.p.f. (B) An increase in lysotracker staining was observed in and around the otic vesicle of sumf1−/− larvae compared to wt larvae at 5 d.p.f., whereas no differences between the two groups were observed at 10 d.p.f. (A–C) Representative images of the lysotracker staining, brightfield and the z projection. At least 5 fish were analysed for each group. Scale bar represents 30 µm for all images.