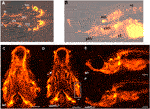
Fig. 6
FIGURE 6. Development of ossification centres in different craniofacial elements. (A,B) Alizarin red stained larvae were imaged at 10 and 15 d.p.f. and scored according to the size of the ossification centre (growth) and intensity of the fluorescent stain. Ossification centres in the vertebrae (vt), otoliths (oto), primary ossification center (oc) for the hyomandibular (hyo), and ceratohyal (ct), maxilla (m), dentary (d), cleithrum (cl), posterior branchiostegal ray (pbr), ceratobranchial 5 (cb5), operculum (op), entopterygoid (en), branchiostegal ray (bcr) 1 and 2 were assessed (see Table 2). At 30 d.p.f., no overt differences in the mineralisation/ossification of the craniofacial skeleton could be identified between wildtype (C,E) and sumf1−/− larvae (D&F). No differences were found in the fluorescent intensity of the operculum (white box) and ceratohyal (white arrow). The scalebar represents 500 μm. Figure shows representative images of n = 3 samples for each genotype.

