
Fig. 4
- ID
- ZDB-IMAGE-220622-31
- Publication
- Fleming et al., 2022 - Unexpected Phenotype Reversion and Survival in a Zebrafish Model of Multiple Sulfatase Deficiency
- All Figures
- Figures for Fleming et al., 2022
|
Fig. 4
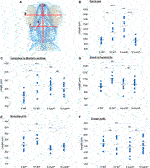
FIGURE 4. Cranial cartilage measurements of wildtype and sumf1 mutant zebrafish at 5 and 10 d.p.f. (A) Schematic diagram indicating measurements of cartilage element representing the following: The distance between the eyes (B), Meckel’s cartilage and ceratohyal (C), snout and the pectoral fin (D), the length of the first branchial arch (E), cranial width (F). Differences in the mean of each measurement was analysed using Welch’s t-test (wildtype and sumf1−/−; 5 d.p.f. and 10 d.p.f.) and the p-values are denoted as following: ns: p > 0.05, *: p ≤ 0.05, **: p ≤ 0.01, and ***: p ≤ 0.001. Means values are indicated by the line.