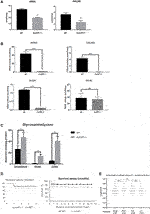
Fig. 2
FIGURE 2. Sulfatase activity, GAG accumulation and viability of sumf1−/− zebrafish. (A) Activities of arylsulfatase A (ARSA) and N-acetylgalactosamine-6-sulfatase (GALNS), enzymes that are dependent on FGE function for their activation. Enzymatic activities were measured at 5 d.p.f. in larvae from in-crosses of sumf1_LA+/- adults. A significant reduction in sulfatase activity was confirmed in sumf1−/− larvae, indicating a loss of FGE function. (B) Since larvae from heterozygous females may retain maternal mRNA and/or protein, enzymatic activity assays were performed on sumf1−/− larvae from sumf1−/− parents and compared to wildtype larvae from a wildtype (TL) background. No or negligible levels of ARSA, GALNS, and N-Sulfoglucosamine sulfohydrolase (SGSH) activity could be detected in sumf1−/− larvae at 5 d.p.f. indicating an absence of FGE activity. Beta-galactosidase was included as a control as this enzyme is a lysosomal hydrolase which is not dependent on FGE. (C) Glycosaminoglycan levels were significantly elevated in sumf1−/− larvae at 5 d.p.f. relative to wildtype larvae of the same age. Chondroitin/Dermatan Sulfate (CS/DS) and Heparan Sulfate (HS) apparent levels were calculated using Chondrosine as an internal standard. D0a4: Chondroitin/Dermatan Sulfate Internal Disaccharide 4-sulfation (CS-A, DS) = unsaturated UA-GalNAc (4S); D0a6: Chondroitin Sulfate Internal Disaccharide 6-sulfation (CS-C) = unsaturated UA-GalNAc (6S); D0A0: Heparan Sulfate Internal Disaccharide n-sulfated = unsaturated UA-GlcNS; D0S0: Heparan Sulfate Internal Disaccharide no sulfation = unsaturated UA-GlcNAc. Apparent pmols were calculated using Chondrosine as an internal standard for mass spectrometry-based detection. (D,E) sumf1−/− zebrafish and wildtype fish were reared concomitantly and initially assessed weekly (for 1 month) and then monthly to assess survival. Although an initial drop in viability was observed in sumf1−/− larvae at 14 d.p.f., no further differences in viability were observed up to 12 months of age (D) and no differences in body length were observed in either sex at 30 d.p.f., suggesting that growth was normal (E). For (A–C), graphs show mean values (±SD) from at least 3 biological replicates. Statistical analysis was performed using two-tailed t-test. p > 0.05, *: p ≤ 0.05, **: p ≤ 0.01, and ***: p ≤ 0.001.

