
|
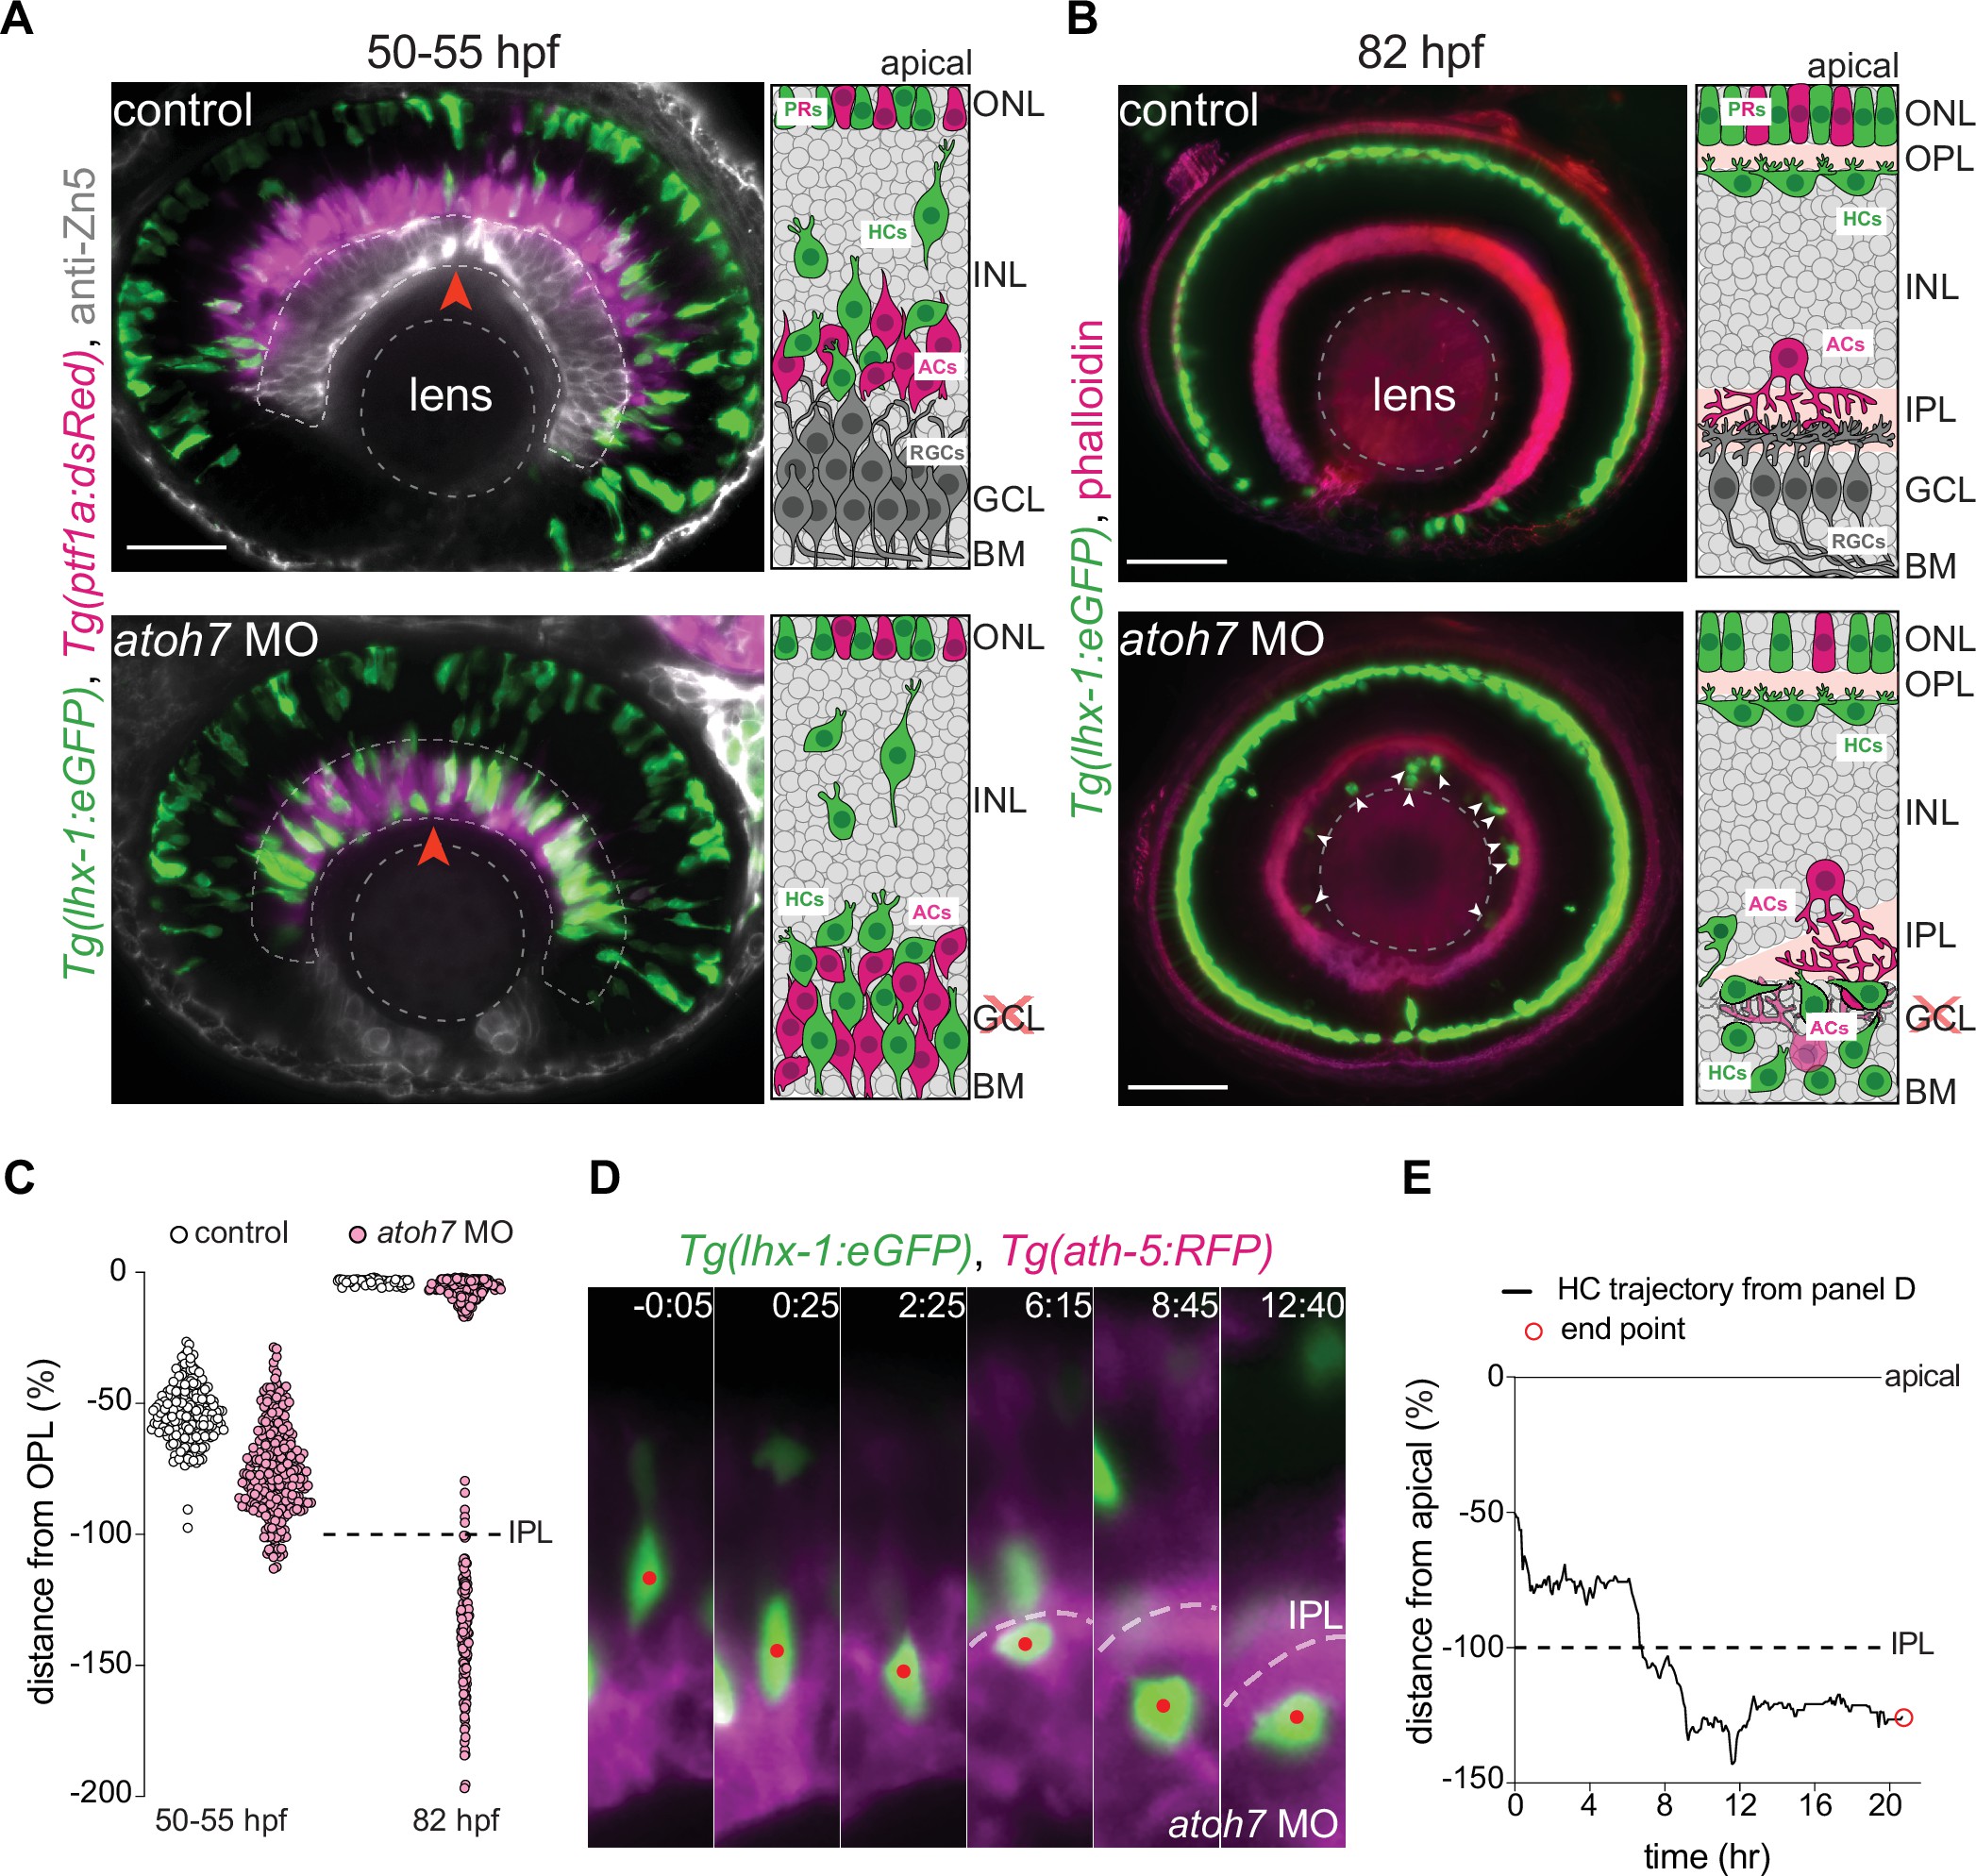
Fig. 6 The inner plexiform layer (IPL) poses a barrier for horizontal cell apical migration. (A–B) Immunofluorescence images of control (top) and atoh7 morpholino (atoh7 MO) [bottom] at 50–55 hours post fertilization (hpf) (A), and at 82 hpf (B). Schemes of each condition are seen on the right. Tg(lhx-1:eGFP) is expressed in horizontal cells (HCs) (green), Tg(ptf1a1:dsRed) is expressed in amacrine cells (ACs) and HCs (magenta), anti-Zn5 marks retinal ganglion cells (RGCs) (gray), and phalloidin marks actin (magenta). In atoh7 MO retinae, the most basal layer is devoid of RGCs (gray in control) and is instead filled with ACs (magenta), and HCs (green). (A) HCs reach ectopic basal positions adjacent to the basement membrane (BM) in atoh7 MO retinae. Red arrowheads: BM. (B) Many HCs remain trapped beneath the IPL in atoh7 MO retinae. White arrowheads: trapped HCs; dashed circle: lens. Scale bar: 50 μm. (C) Position of HCs relative to the outer plexiform layer (OPL) in control (n=196, N=12) and atoh7 MO (n=261, N=14) retinae at 50–55 hpf, and control (n=76, N=11) and atoh7 MO (n=312, N=15) at 82 hpf. At 50–55 hpf, the depth of HC migration increases in atoh7 MO compared to controls. At 82 hpf, many HCs are ectopically located below the IPL in atoh7 MO, while in controls all HCs reached their layer. See Figure 6—source data 1. (D) Time series of an HC (red dot) in atoh7 MO retinae. Dashed line: the IPL. Scale bar: 20 μm. Time in h:min. (E) Migration trajectory of the tracked HC from (D). See Figure 6—source data 1.See also Figure 6—figure supplement 1.