
|
Fig. 5 - supplement 1
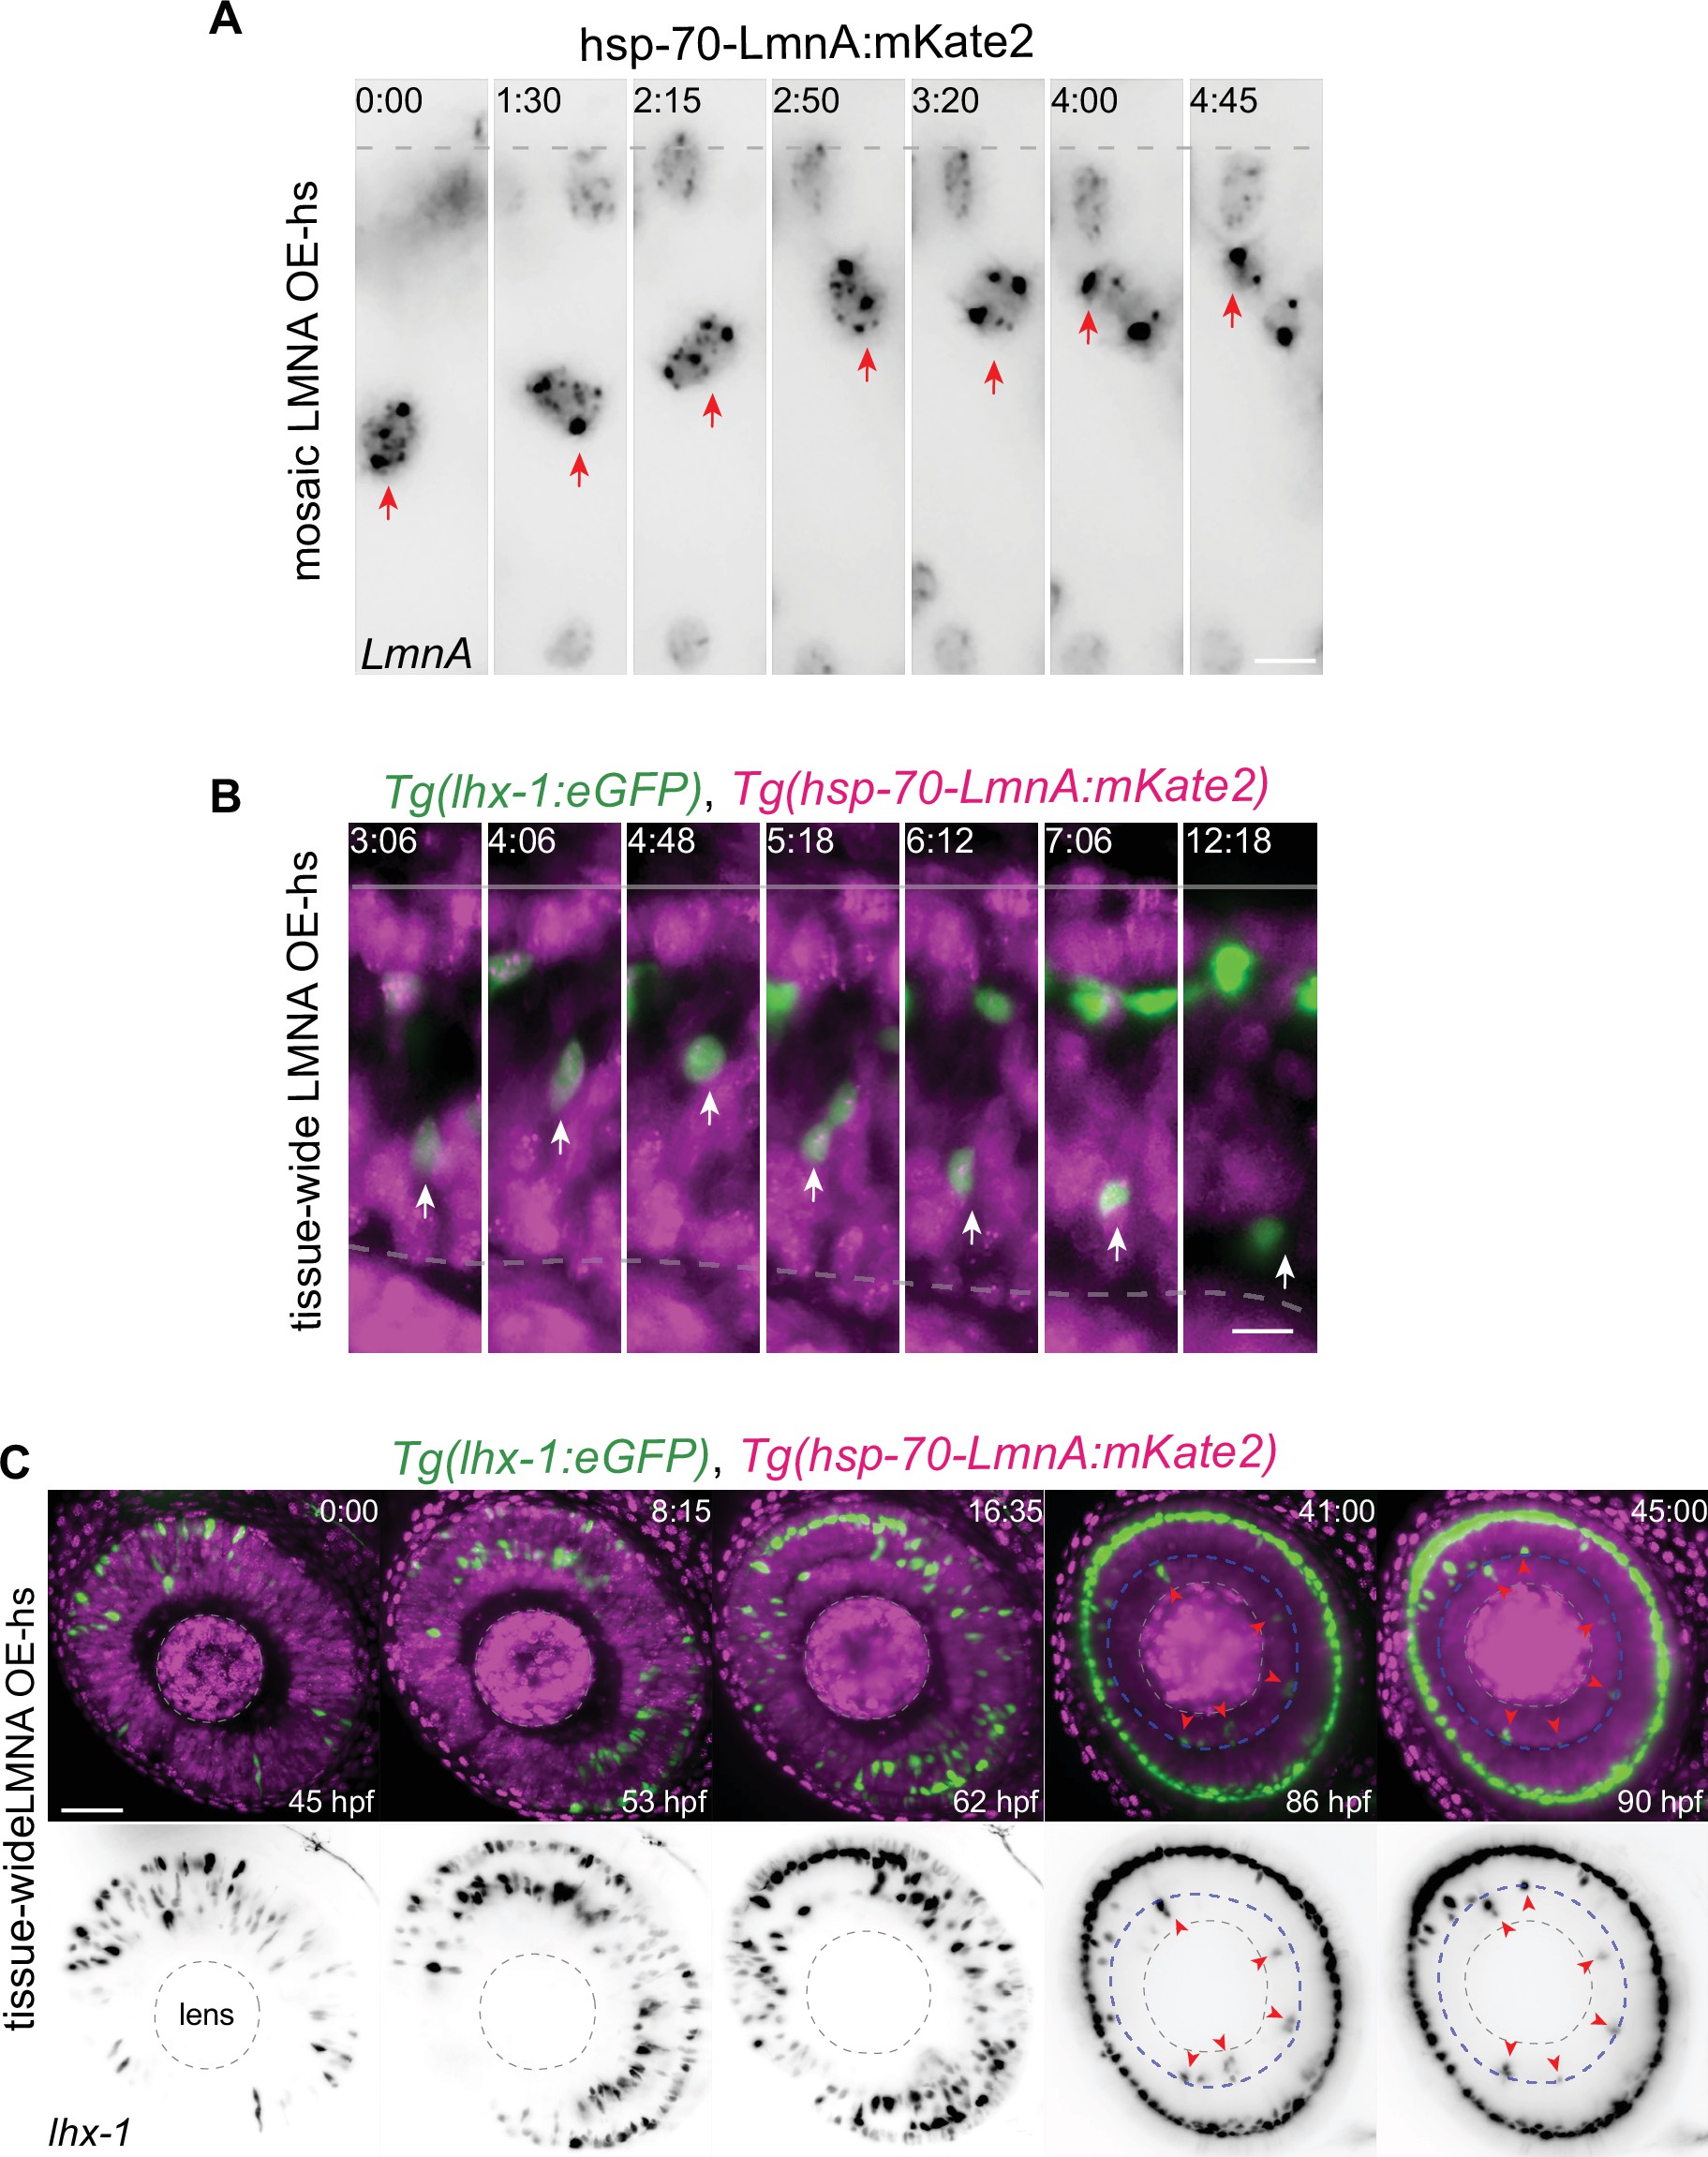
(A) Representative time series of migration dynamics of an LmnA-mKate2 overexpressing horizontal cell (HC), when its surrounding cells do not express LmnA-mKate2. LMNA overexpression of HCs at the single-cell level does not impede their migration and layer formation. hsp-70-LmnA:mKate2 DNA plasmid labels LMNA overexpressed nuclei upon heat-shock. Red arrows: tracked HC; dashed line: apical surface. Scale bar: 10 μm. (B) Representative time series of HCs in Tg(lhx-1:eGFP) × Tg(hsp70:LMNA-mKate2) double-transgene retinae. Tissue-scale LMNA overexpression after heat-shock (LMNA OE-hs) impairs HC migration and layer formation. White arrows: tracked HC; line: apical surface; dashed line: inner plexiform layer (IPL). Scale bar: 10 μm. (C) Representative time series of HC migration and layer formation in LmnA-mKate2 overexpressed retina for 45 hr from 45 hpf shows that tissue-scale LMNA overexpression impairs HC migration and layer formation. Tg(lhx-1:eGFP) labels HC (green) and Tg(hsp70:LMNA-mKate2) is expressed in nuclear envelopes upon heat-shock (magenta). Red arrowheads: trapped HCs, white dashed circle: lens, blue dashed line: IPL. Scale bar: 50 μm. Time in h:min (A–C).
Analysis of Laminin overexpression in HC mosaic and whole tissue.