
|
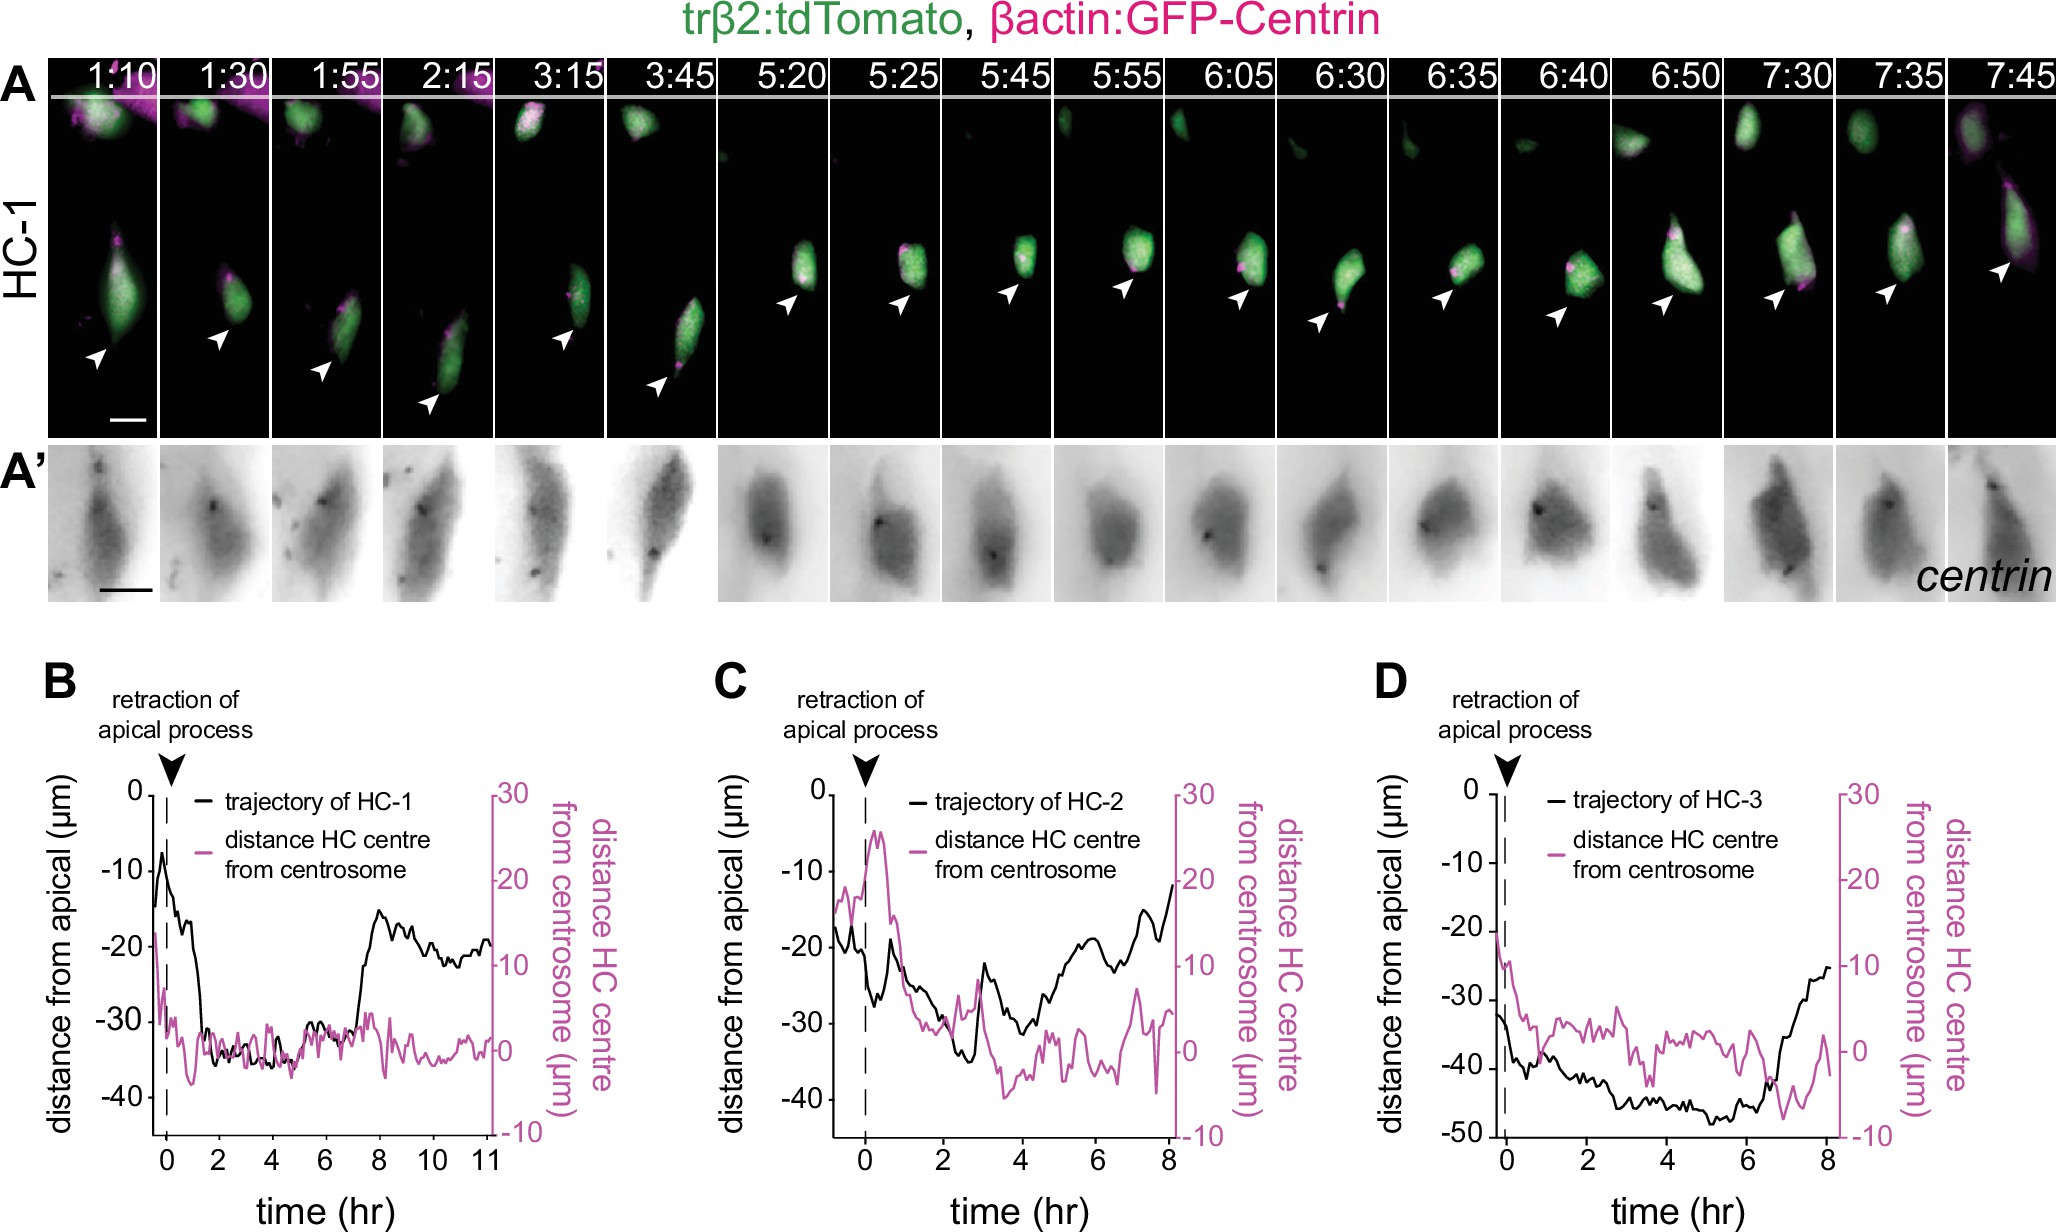
Fig. 4 - supplement 2 Analysis of HC centrosome position. (A–A’) Time series showing the dynamics of centrosome position in a migrating horizontal cell (HC) (HC-1). β-Actin:GFP-Centrin and trβ2:tdTomato DNA plasmids label centrosomes (magenta) and HCs (green), respectively. Arrowhead: tracked HC; white line: apical surface. (A’) Close-up of β-actin:GFP-Centrin (gray) in HC from (A). Scale bar: 5 μm. Time in h:min. (B–D) Graphs showing migration trajectory of three tracked HCs (black line), and the distance between their centrosomes and center (magenta line) throughout migration. See Figure 4—source data 3. Arrowhead: time of detachment from the apical surface. (B) Representing HC-1 from (A).