
|
Fig. 3
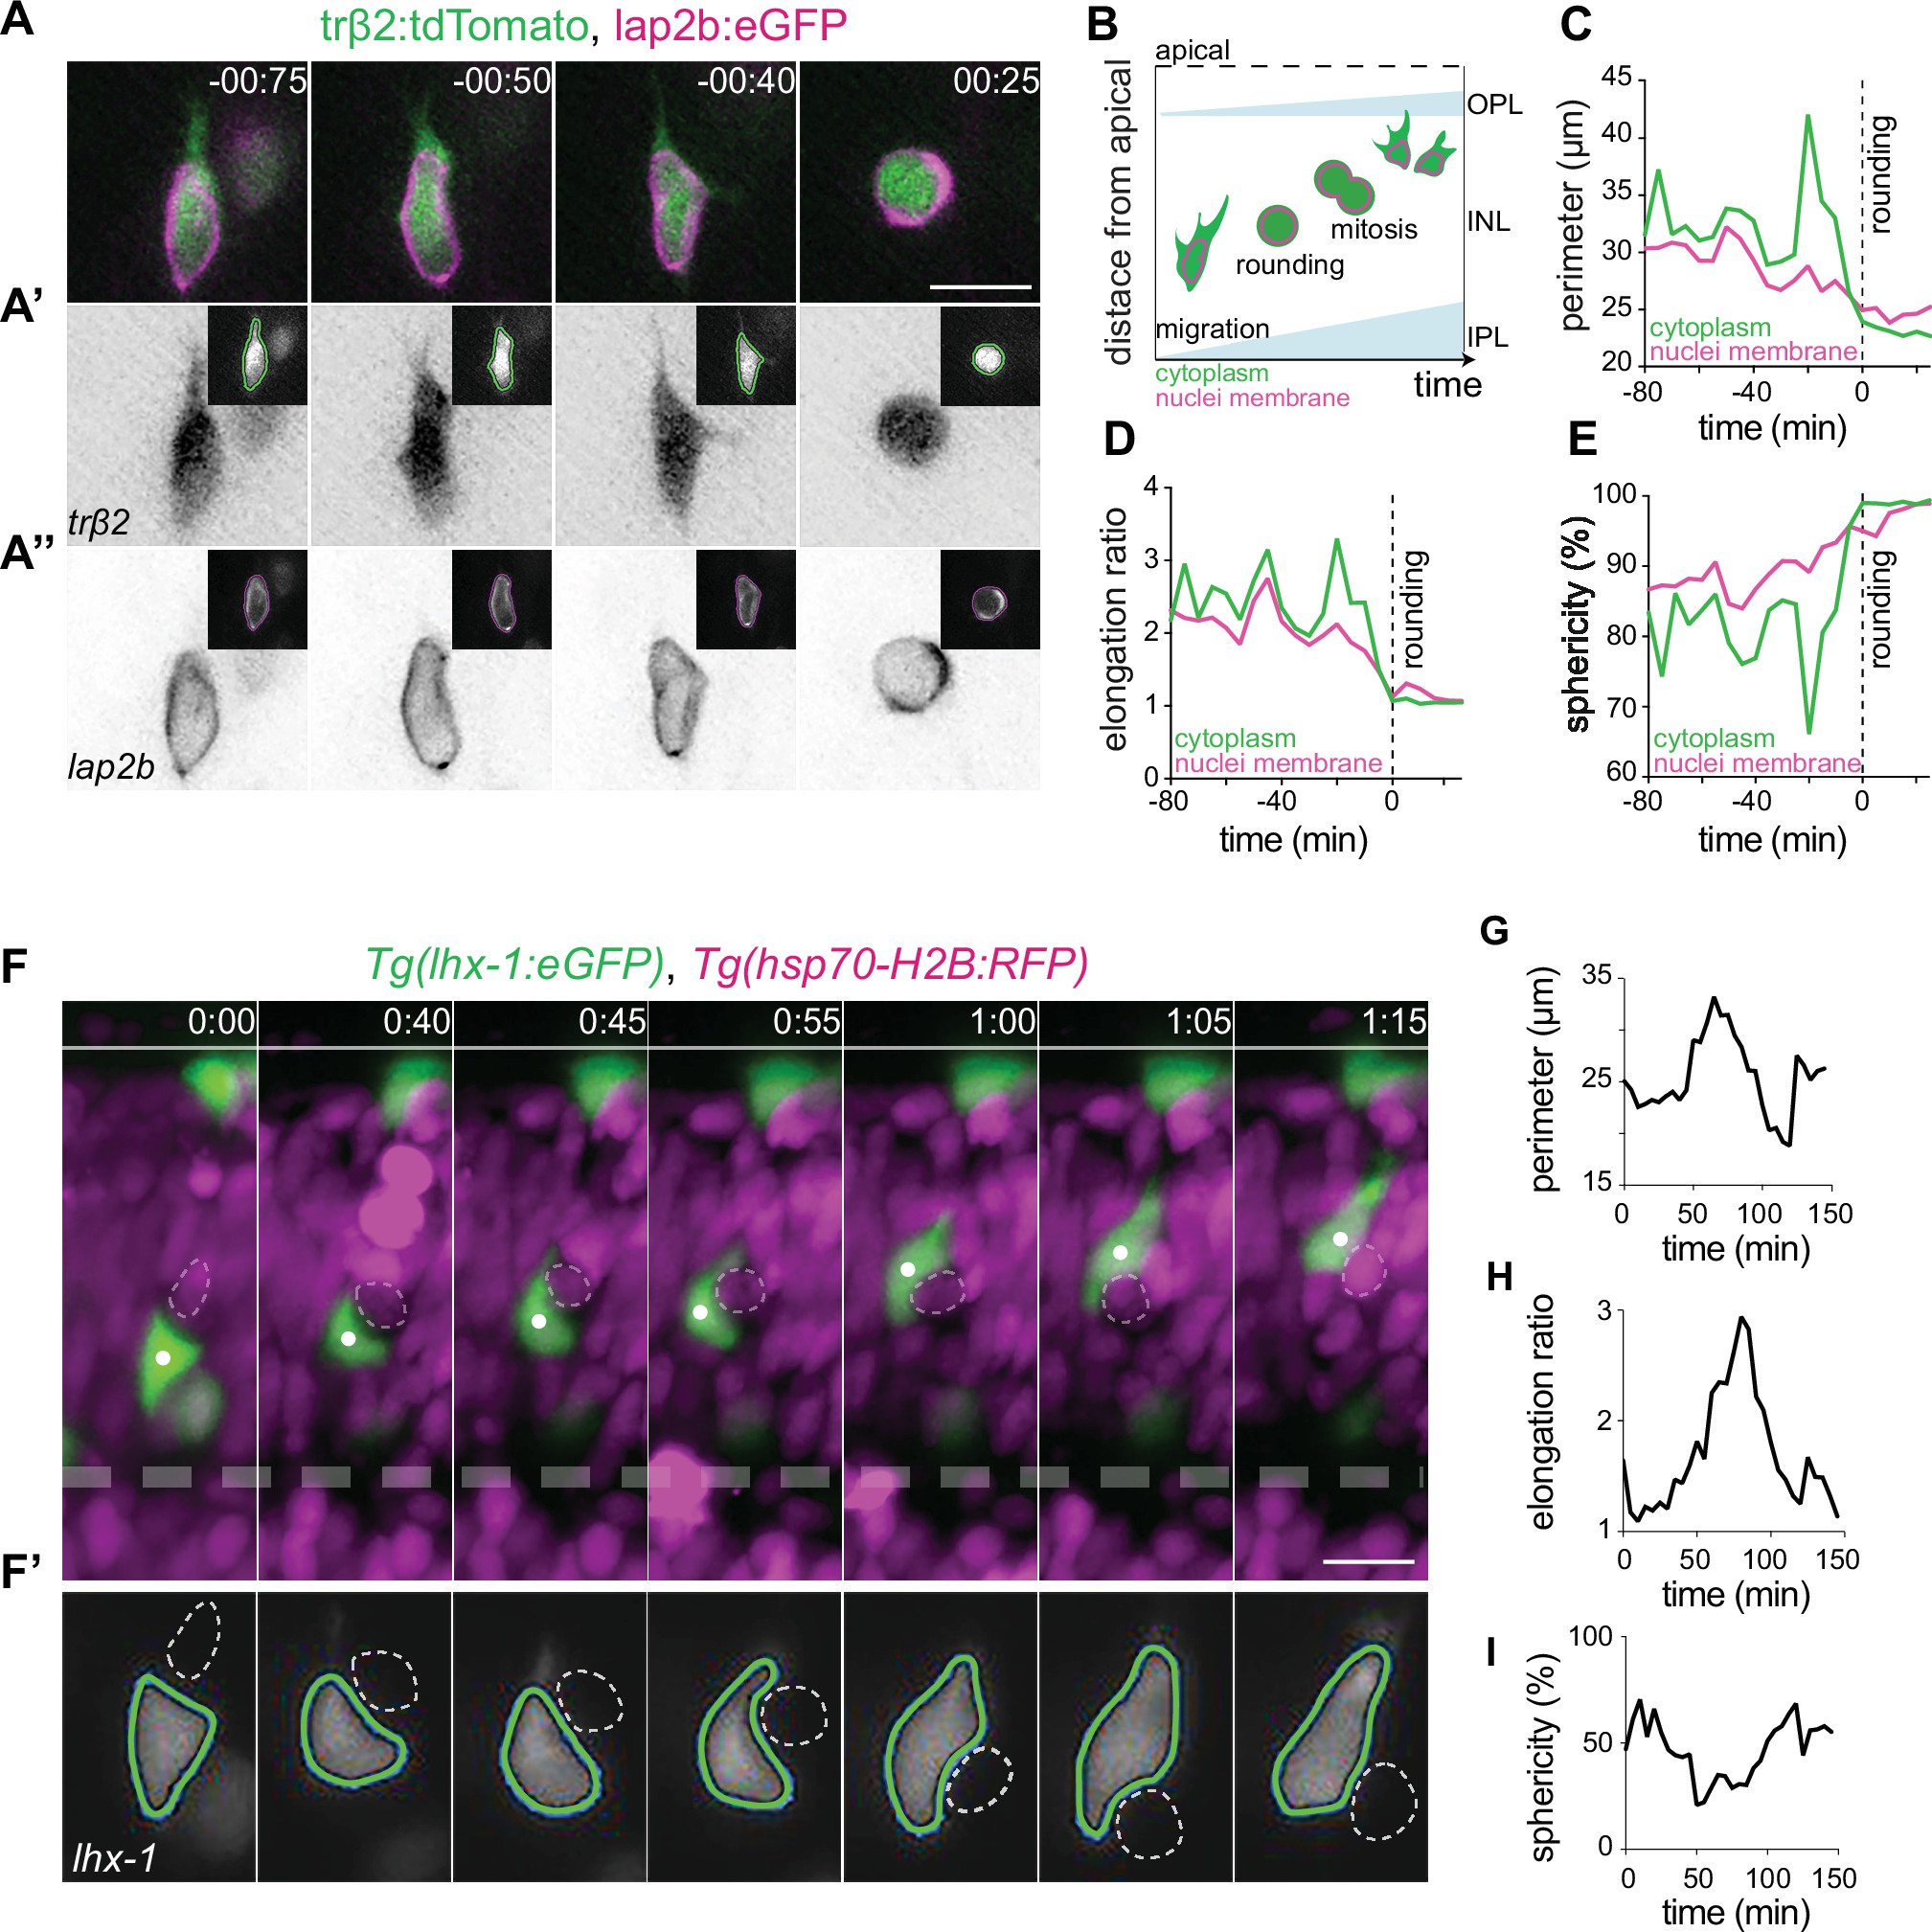
(A–E) The cell bodies and nuclei of migrating horizontal cells (HCs) are deformable. (A) Time-lapse of an HC during migration and at entry into mitosis. The HC cell body is visualized by trβ2:tdTomato (green), and its nuclear envelope by lap2b:eGFP (magenta) DNA constructs. Insets show the corresponding segmented contours of the tracked HC’s generated by Icy: (A’) cell body (green lines) and (A’’) nucleus (magenta lines) which were used to extract cellular and nuclear morphodynamic features in (C–E). Scale bar: 10 µm. (B) Schematic representation of a typical basal-to-apical migration trajectory of an HC progenitor which undergoes mitosis en route. During mitosis, HCs switch from an elongated shape into a spherical morphology. (C–E) Graphs show quantification of the dynamics of the cell and nucleus shape changes of the migrating HC depicted in (A): (C) perimeter (μm), (D) elongation ratio, and (E) sphericity (%). Note that the minimal perimeter (μm), minimal elongation ratio, and maximal sphericity (%) are reached upon cell rounding during mitosis. Dashed lines: onset of HC rounding. See Figure 3—source data 1. (F–I) Migrating HCs squeeze in the crowded retina to overcome local physical obstacles. (F) Stills from light-sheet time-lapse imaging show that the migrating HC (green) undergoes cell-shape deformations to circumvent a mitotic neighboring cell (dashed circle). Tg(lhx-1:eGFP) labels HCs (green), Tg(hsp70-H2B:RFP) marks nuclei of all retinal cells (magenta). White dot: tracked HC; line: apical surface; dashed line: inner plexiform layer (IPL). Scale bar: 20 µm. (F’) The automated segmented contours of the cell body of the migrating HC (green line) generated by Icy. Dashed circle: the nucleus of the neighboring cell from (F). (G–I) Graphs represent quantifications of cell morphodynamic changes in HC from (F–F’): (G) perimeter (μm), (H) elongation ratio, and (I) sphericity (%). Time in h:min (A, F). See Figure 3—source data 1. See also Figure 3—figure supplements 1 and 2.
Horizontal cells undergo cell and nuclear deformations as they migrate through the crowded inner nuclear layer (INL).