
|
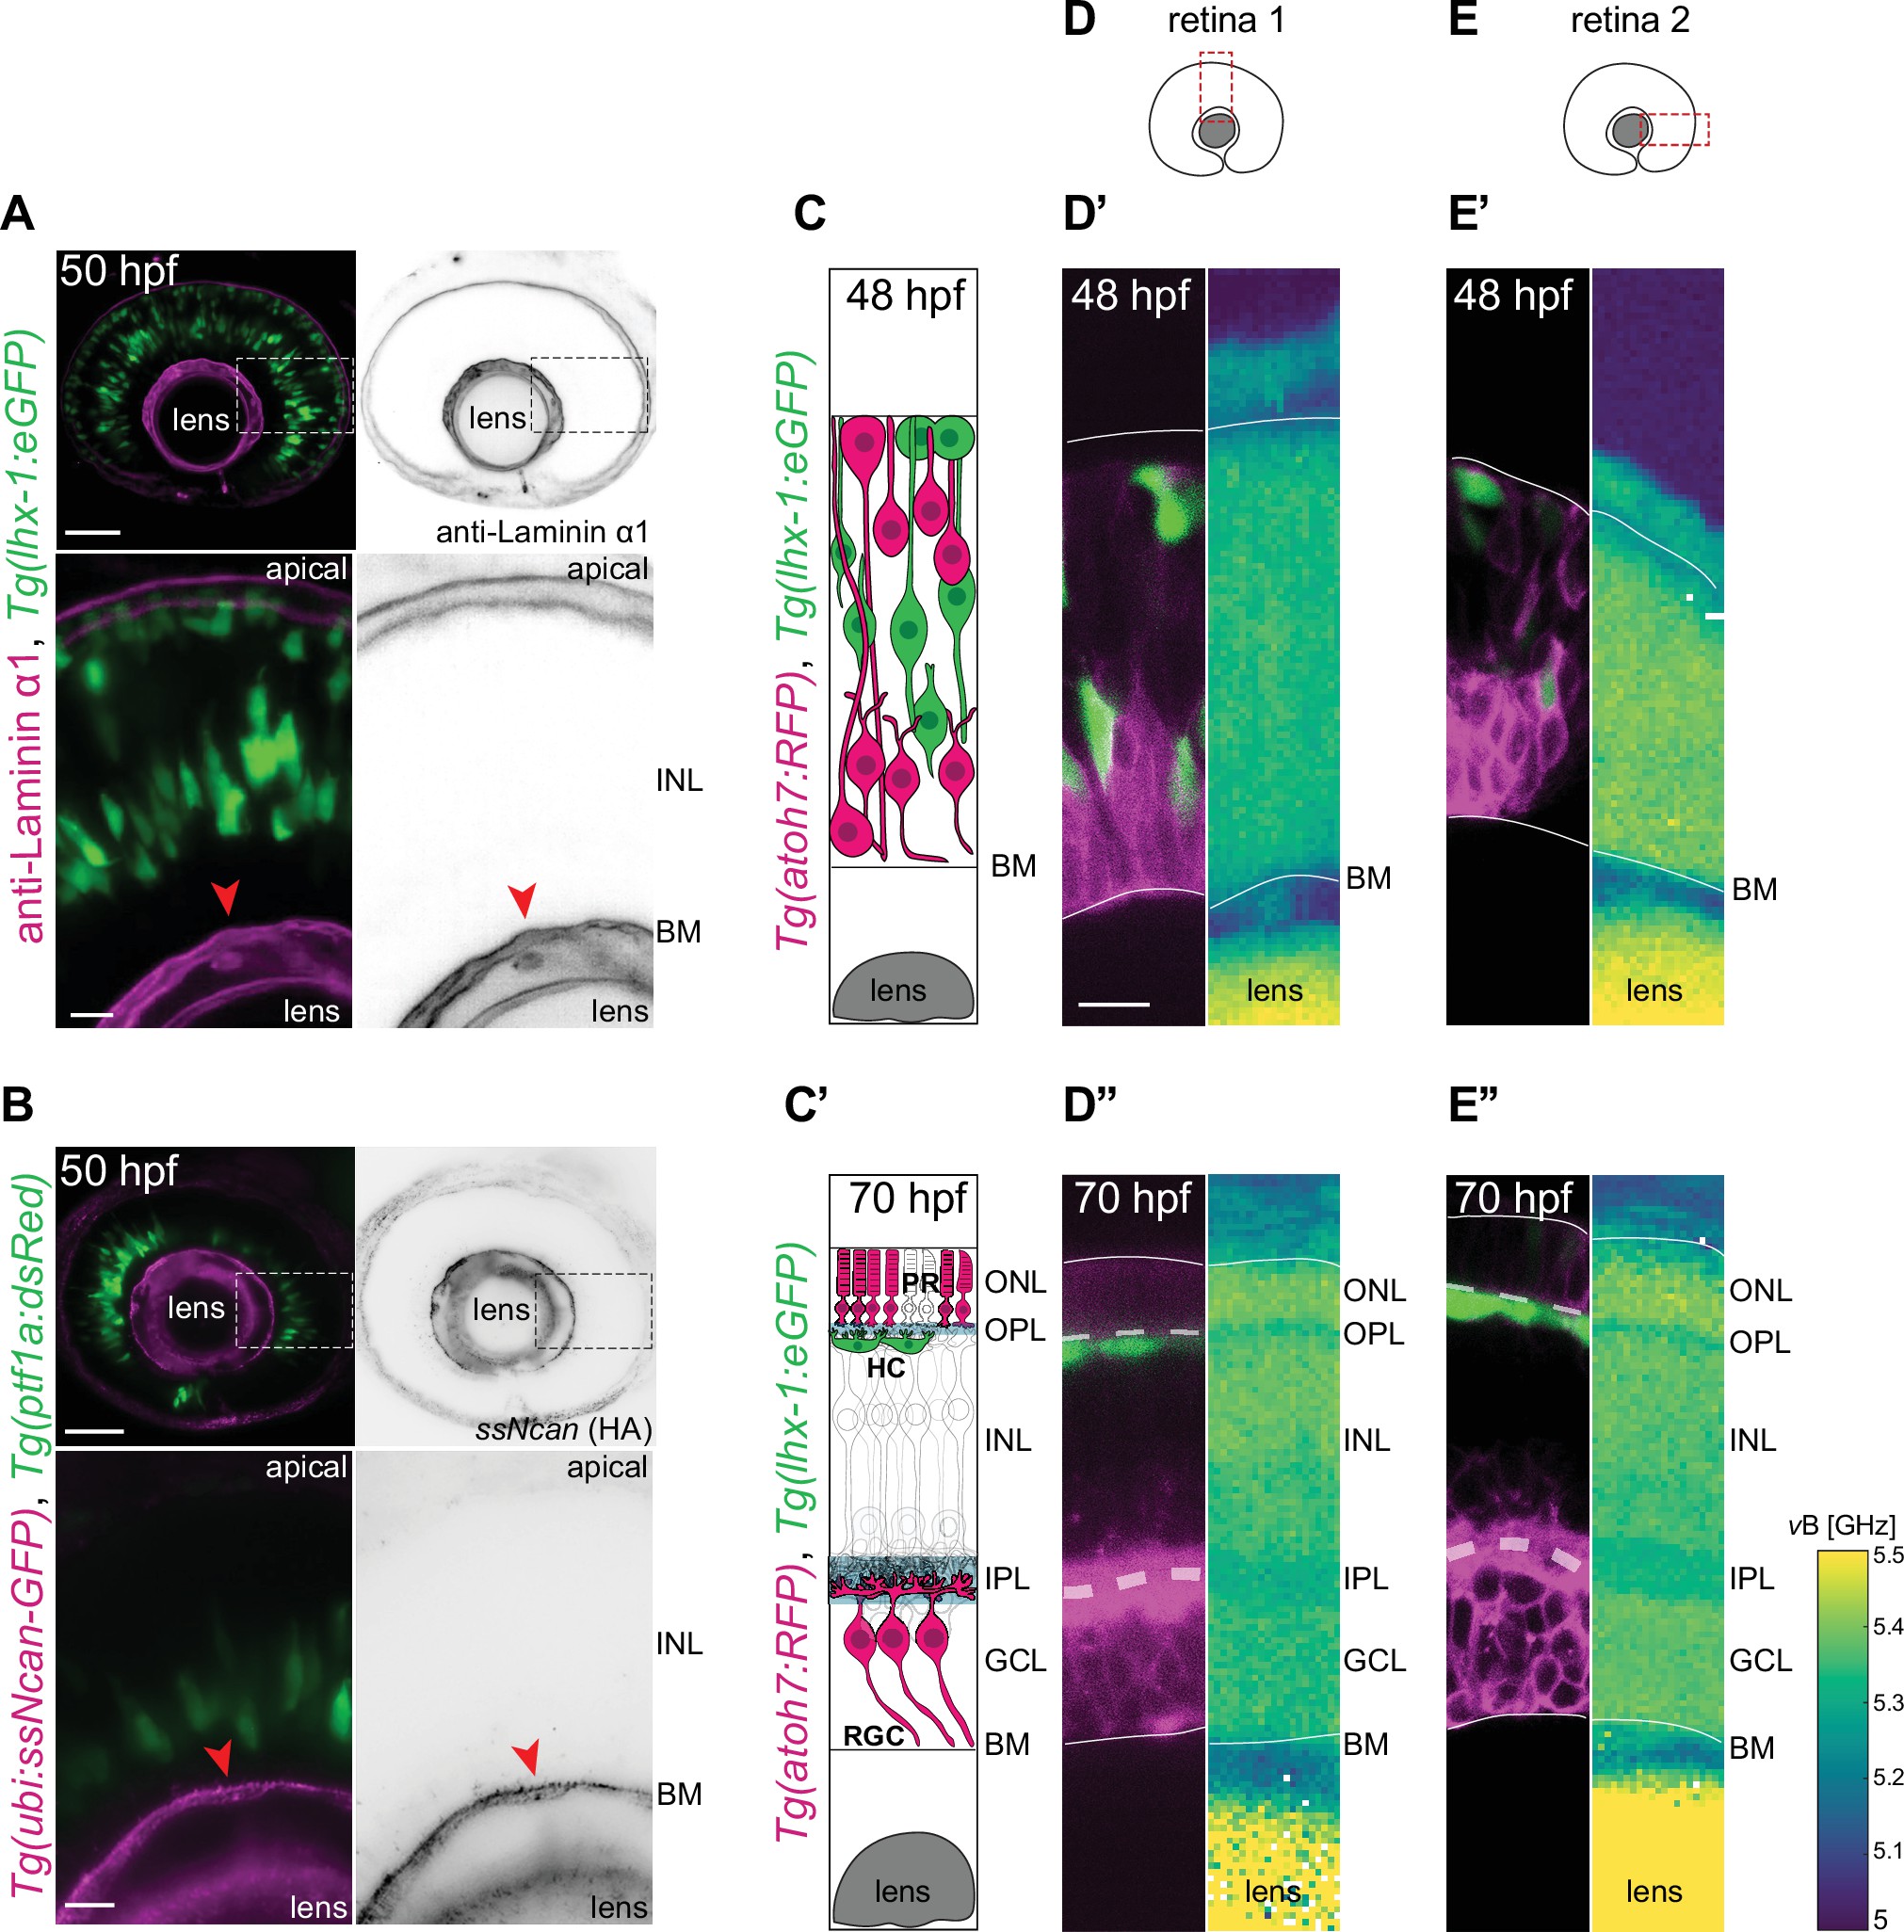
Fig. 2
(A–B) The INL is not dominated by ECM: (A) Tg(lhx-1:eGFP) labels horizontal cells (HCs) (green). Laminin α1 antibody marks laminin (magenta). (B) Tg(ptf1a:dsRed) marks HCs and amacrine cells (ACs) (green). Tg(HA:GFP) labels hyaluronic acid (HA) (magenta). Higher magnification insets show enrichment of anti-Laminin α1 and HA in the basement membrane (BM) (red arrowheads). Scale bars: 50 μm; insets 10 μm. (C–C’) Scheme of structural organization of the retina during development: (C) During HC migration at 48 hours post fertilization (hpf); (C’) after HC layer formation at 70 hpf. HCs (green); photoreceptors (PRs) and retinal ganglion cells (RGCs) (magenta). (D–E”) Brillouin shift maps (right) and their corresponding confocal images (left) of double-transgenic zebrafish of (D–D’’) retina 1 and (E-E’’) retina 2. Top: 48 hpf, and bottom: 70 hpf. Tg(lhx-1:eGFP) labels HCs and ACs (green), Tg(atoh7:RFP) is expressed in RGCs and PRs (magenta). Confocal images were obtained directly after the Brillouin shift measurements. The corresponding Brillouin shift maps of the nuclear layers (outer nuclear layer [ONL], inner nuclear layer [INL], ganglion cell layer [GCL]) show a higher Brillouin shift than the plexiform layers (outer plexiform layer [OPL], inner plexiform layer [IPL]) at 70 hpf. Red dashed boxes in D–E: imaged regions. Scale bar: 10 µm. See also Figure 2—figure supplement 1.
The inner nuclear layer (INL) is a densely packed tissue not dominated by extracellular matrix (ECM).