
Image
|
Figure Caption
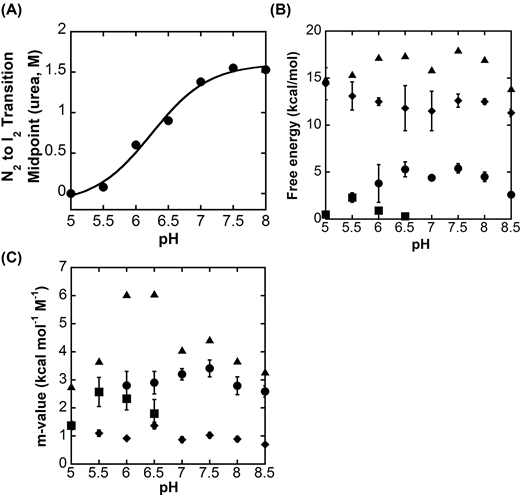
Fig. 5
Conformational free energy of DrPCP3b versus pH
(A) The midpoint of the transition between native dimer (N2) and the first dimeric folding intermediate (I2) (●). The solid line represents a fit of the data to determine pKa, as described in the text. (B) Free energies for (●), (■), (♦) and (▲) versus pH. (C) Cooperativity indices, m1 (●), m2 (■), m3 (♦) and mtotal (▲) versus pH. Data for panels (B and C) were determined from global fits of the data shown in Supplementary Figure S2 and S3 to the models shown in (eqns 2 and 3), as described in the text. The error bars show the standard error obtained from the global fits.
Acknowledgments
This image is the copyrighted work of the attributed author or publisher, and
ZFIN has permission only to display this image to its users.
Additional permissions should be obtained from the applicable author or publisher of the image.
Full text @ Biosci. Rep.