
Image
|
Figure Caption
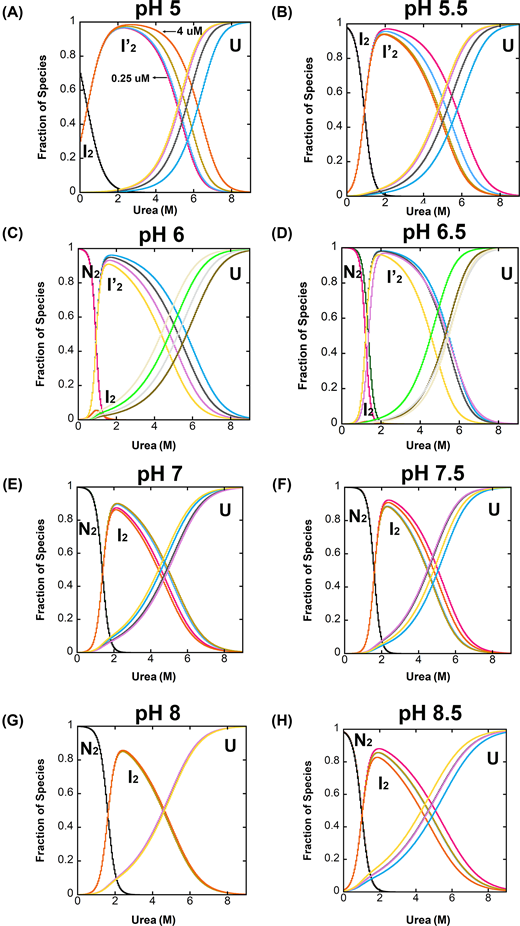
Fig. 4
Fraction of species as a function of urea concentration over the pH range of 5 to 8.5
The fractions of species versus urea concentration at pH 5 (A), pH 5.5 (B), pH 6 (C), pH 6.5 (D), pH 7 (E), pH 7.5 (F), pH 8 (G) and pH 8.5 (H) were calculated from global fits of the equilibrium folding/unfolding data shown in Supplemental Figures S2 and S3, the parameters shown in Table 1, and the protein concentrations of 0.5, 1, 2 and 4 µM. Each species, N2, I2, I2’, U, is labeled in the figures. N2 refers to the native dimer of DrPCP3b, while I2’ and I2 refer to partially folded intermediate conformations of the dimer, and U refers to the unfolded state of the protein.
Acknowledgments
This image is the copyrighted work of the attributed author or publisher, and
ZFIN has permission only to display this image to its users.
Additional permissions should be obtained from the applicable author or publisher of the image.
Full text @ Biosci. Rep.