
Image
|
Figure Caption
Fig. 3
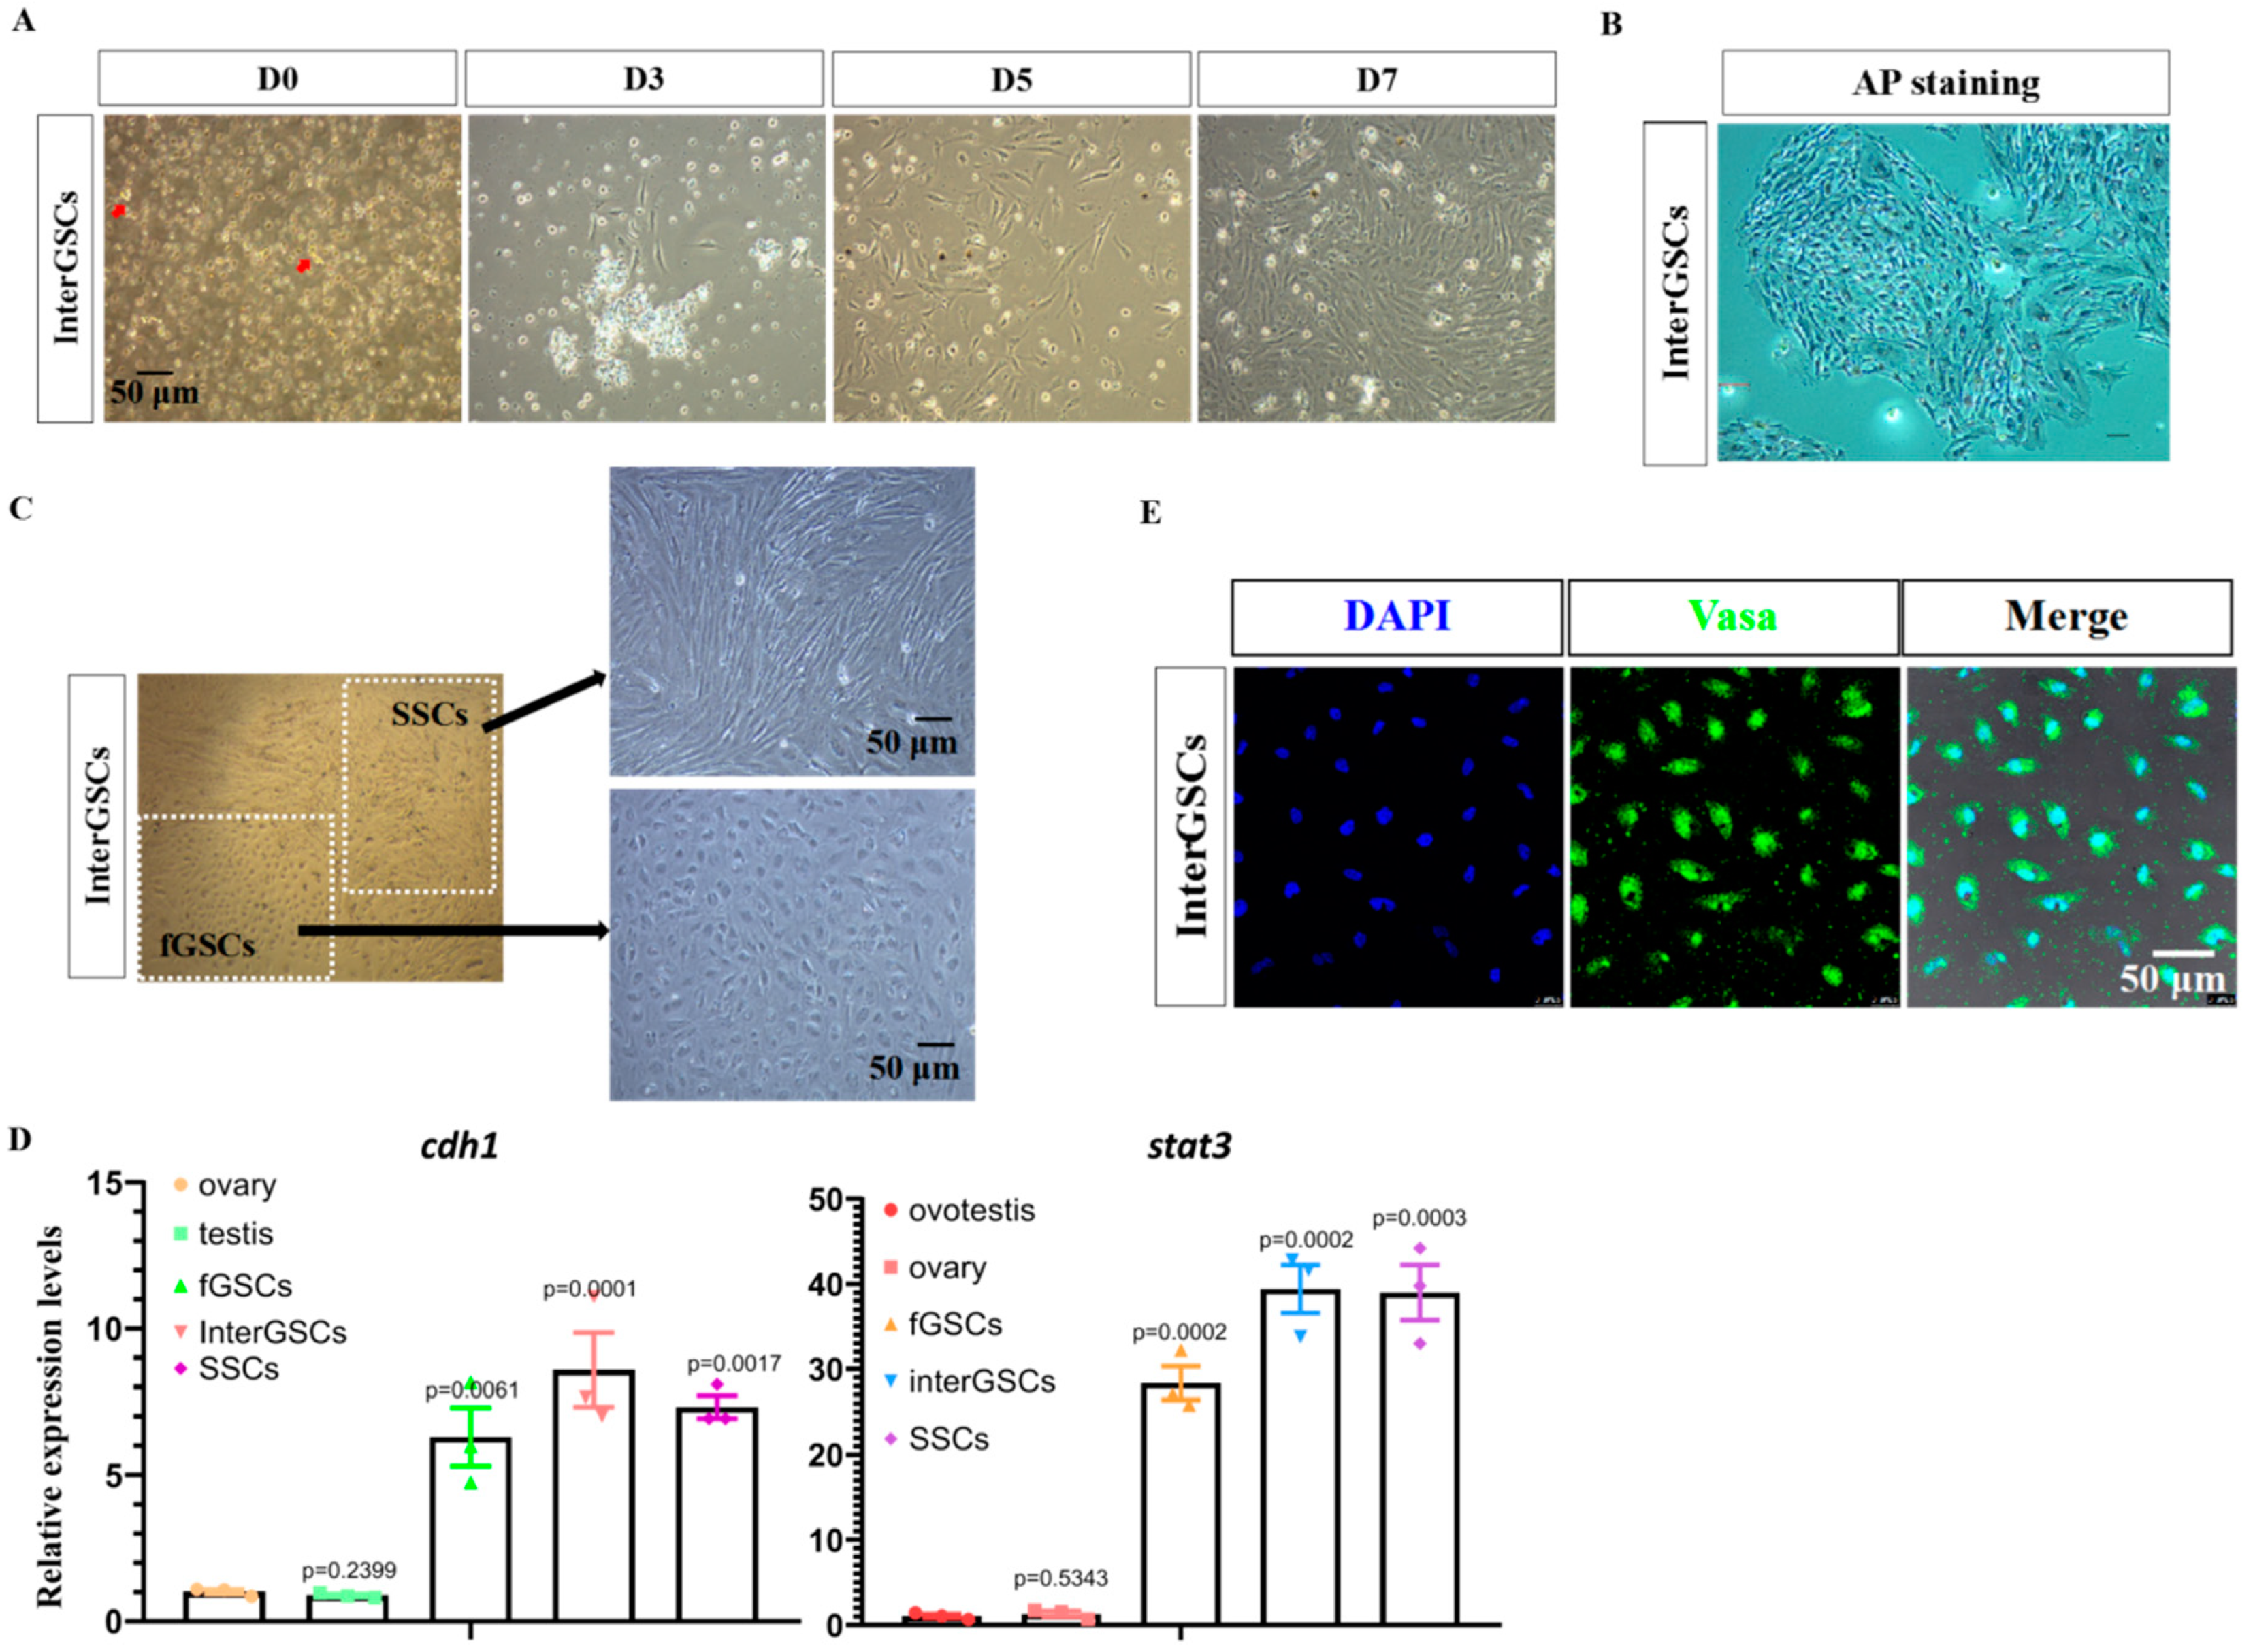
Figure 3. Isolation and characterization of interGSCs derived from ovotestis. (A) Cell morphology of GSCs isolated from ovotestis at the indicated time after isolation. Red arrows show the grape-like GSCs. (B) Image of AP staining of interGSCs isolated from ovotestis. (C) Cell morphology showing the presence of two morphologically distinct cell types. (D) qRT-PCR results of cdh1 and stat3 in fGSCs, SSCs, and interGSCs, compared with whole ovary, testis, and ovotestis tissues. (E) Immunofluorescence images for day 7 interGSCs.
Acknowledgments
This image is the copyrighted work of the attributed author or publisher, and
ZFIN has permission only to display this image to its users.
Additional permissions should be obtained from the applicable author or publisher of the image.
Full text @ Int. J. Mol. Sci.