
Image
|
Figure Caption
Fig. 1
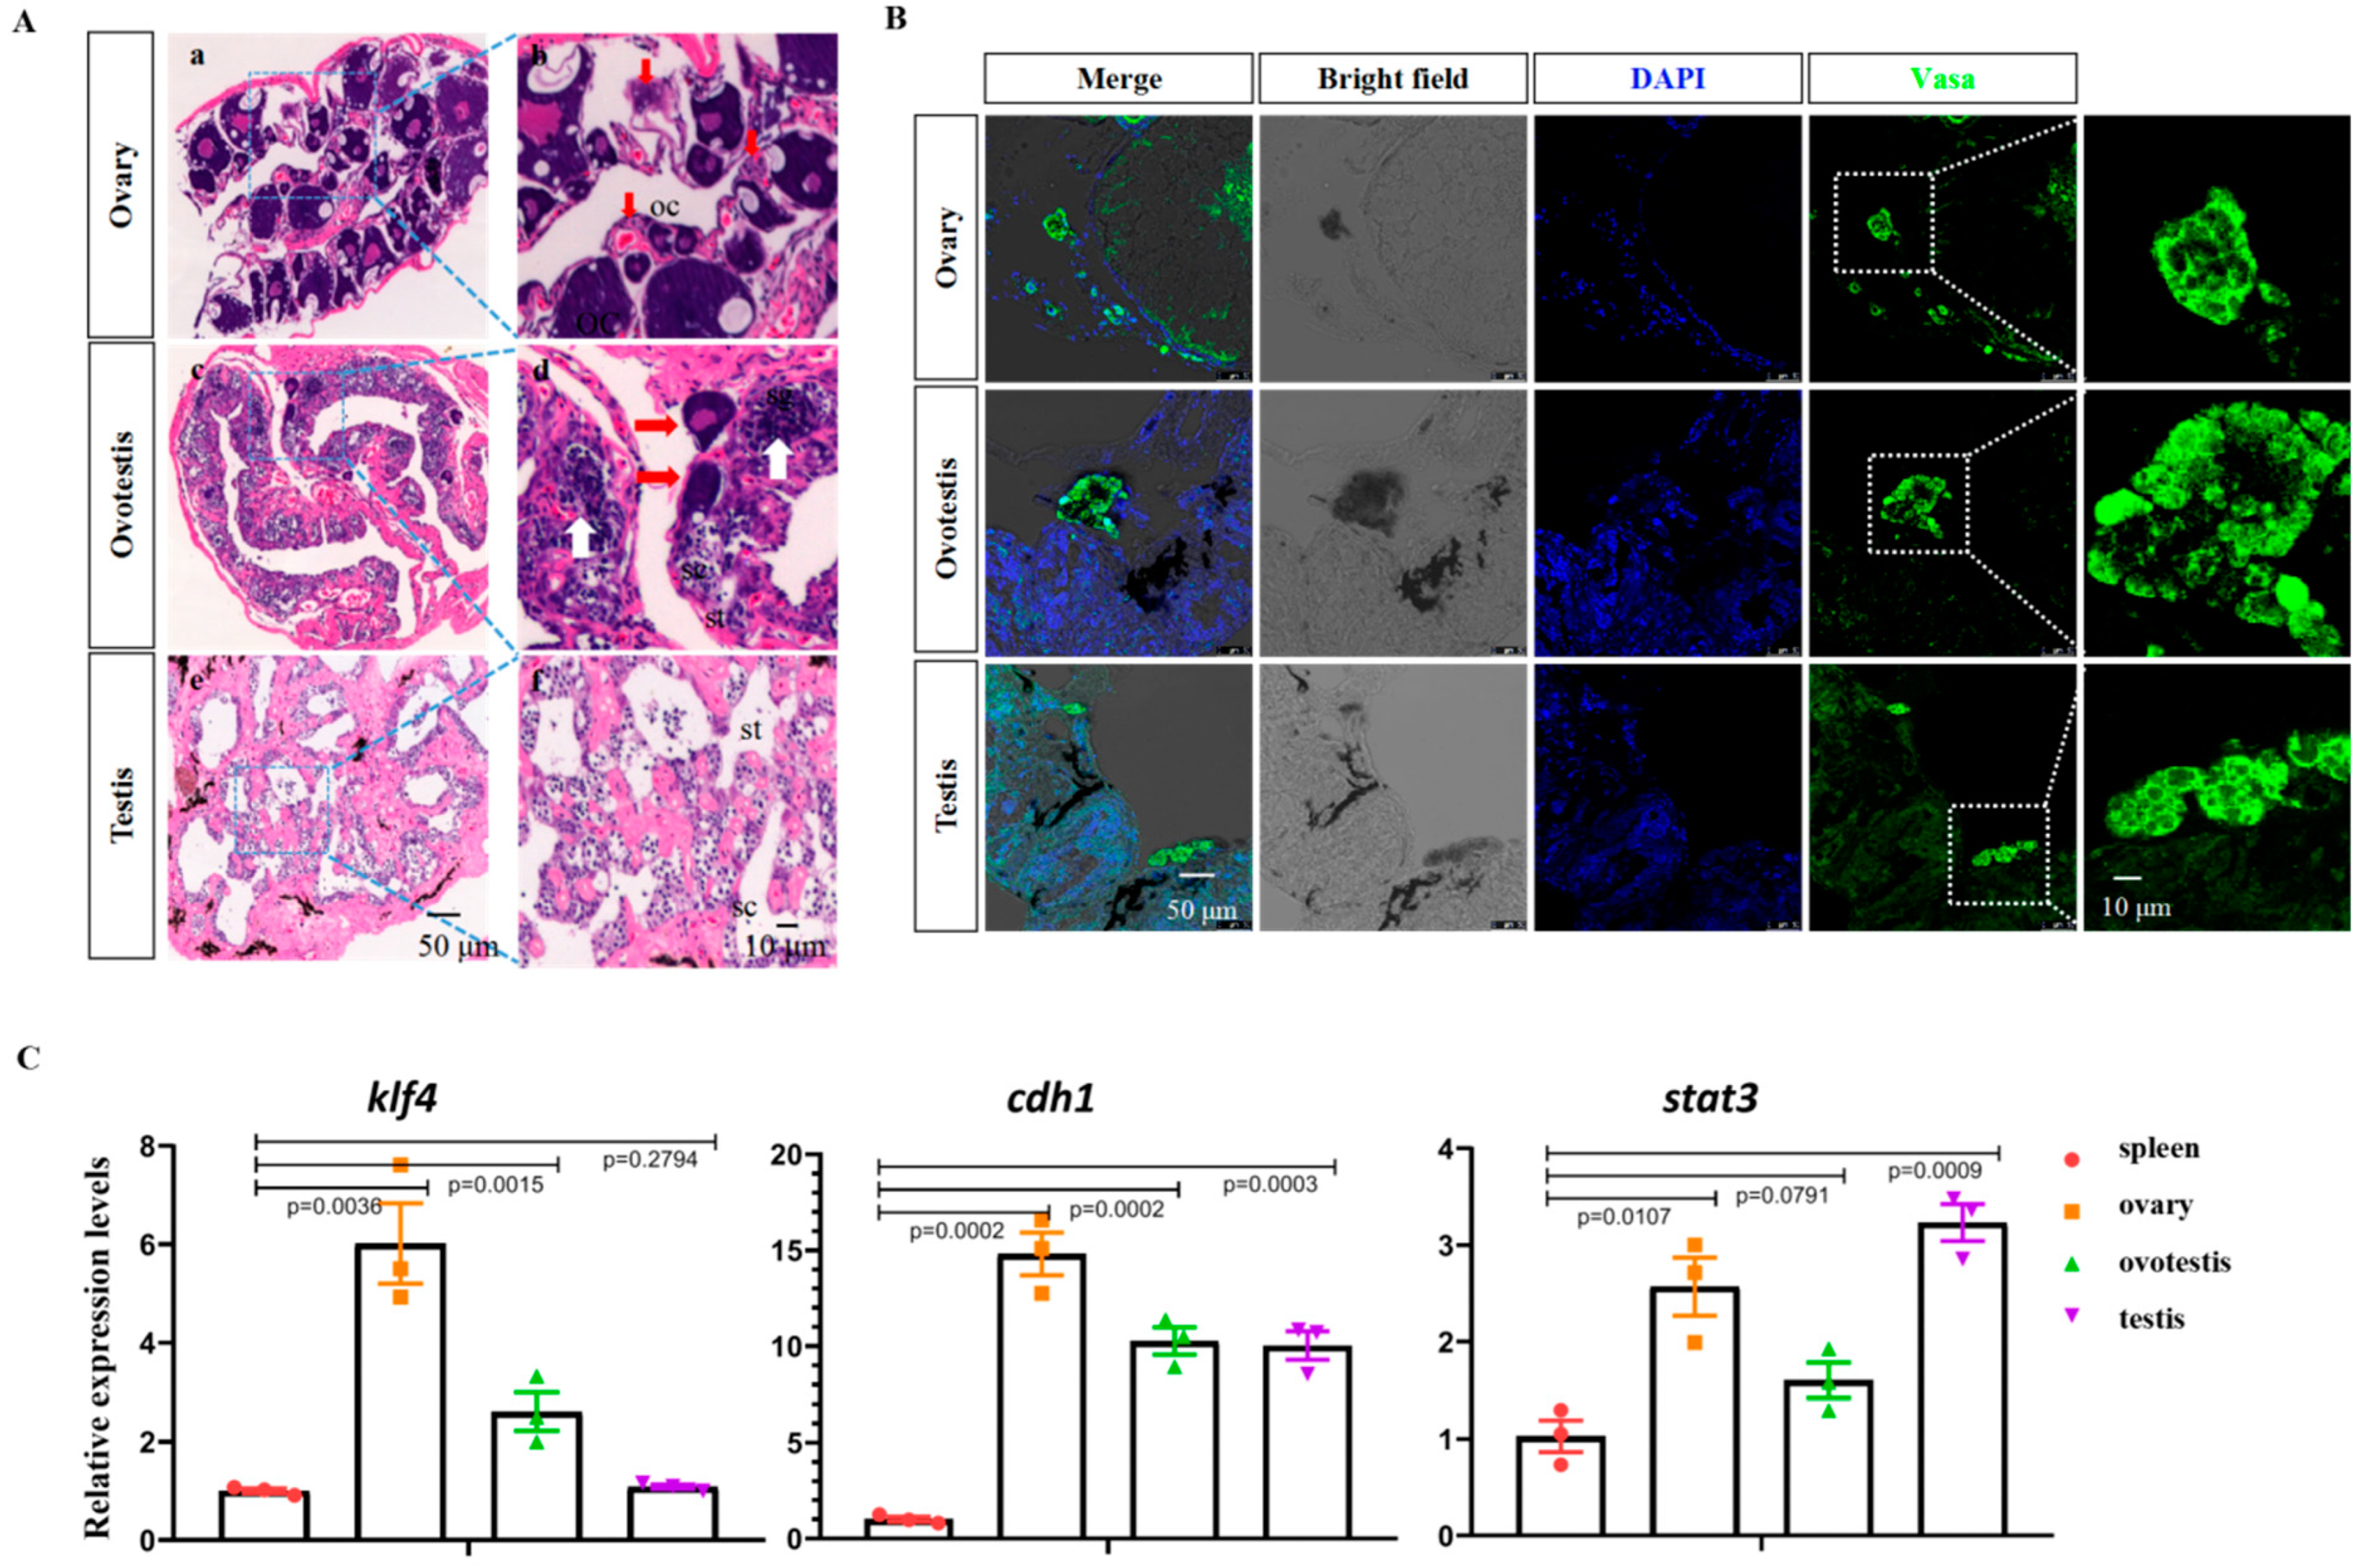
Figure 1. Identification of swamp eel germline stem cells at different stages. (A) H&E staining of ovary (a,b), ovotestis (c,d), and testis (e,f) tissues. Red arrows show the oocytes of different stages, and white arrows show the spermatocytes. oc: oocyte; sg: spermatogonia; st: round spermatids. (B) Confocal images showing the Vasa-positive cells in the adult ovary, ovotestis, and testis. (C) qRT-PCR results showing the expression of pluripotency and GSC marker genes in different types of gonads.
Acknowledgments
This image is the copyrighted work of the attributed author or publisher, and
ZFIN has permission only to display this image to its users.
Additional permissions should be obtained from the applicable author or publisher of the image.
Full text @ Int. J. Mol. Sci.