
Image
|
Figure Caption
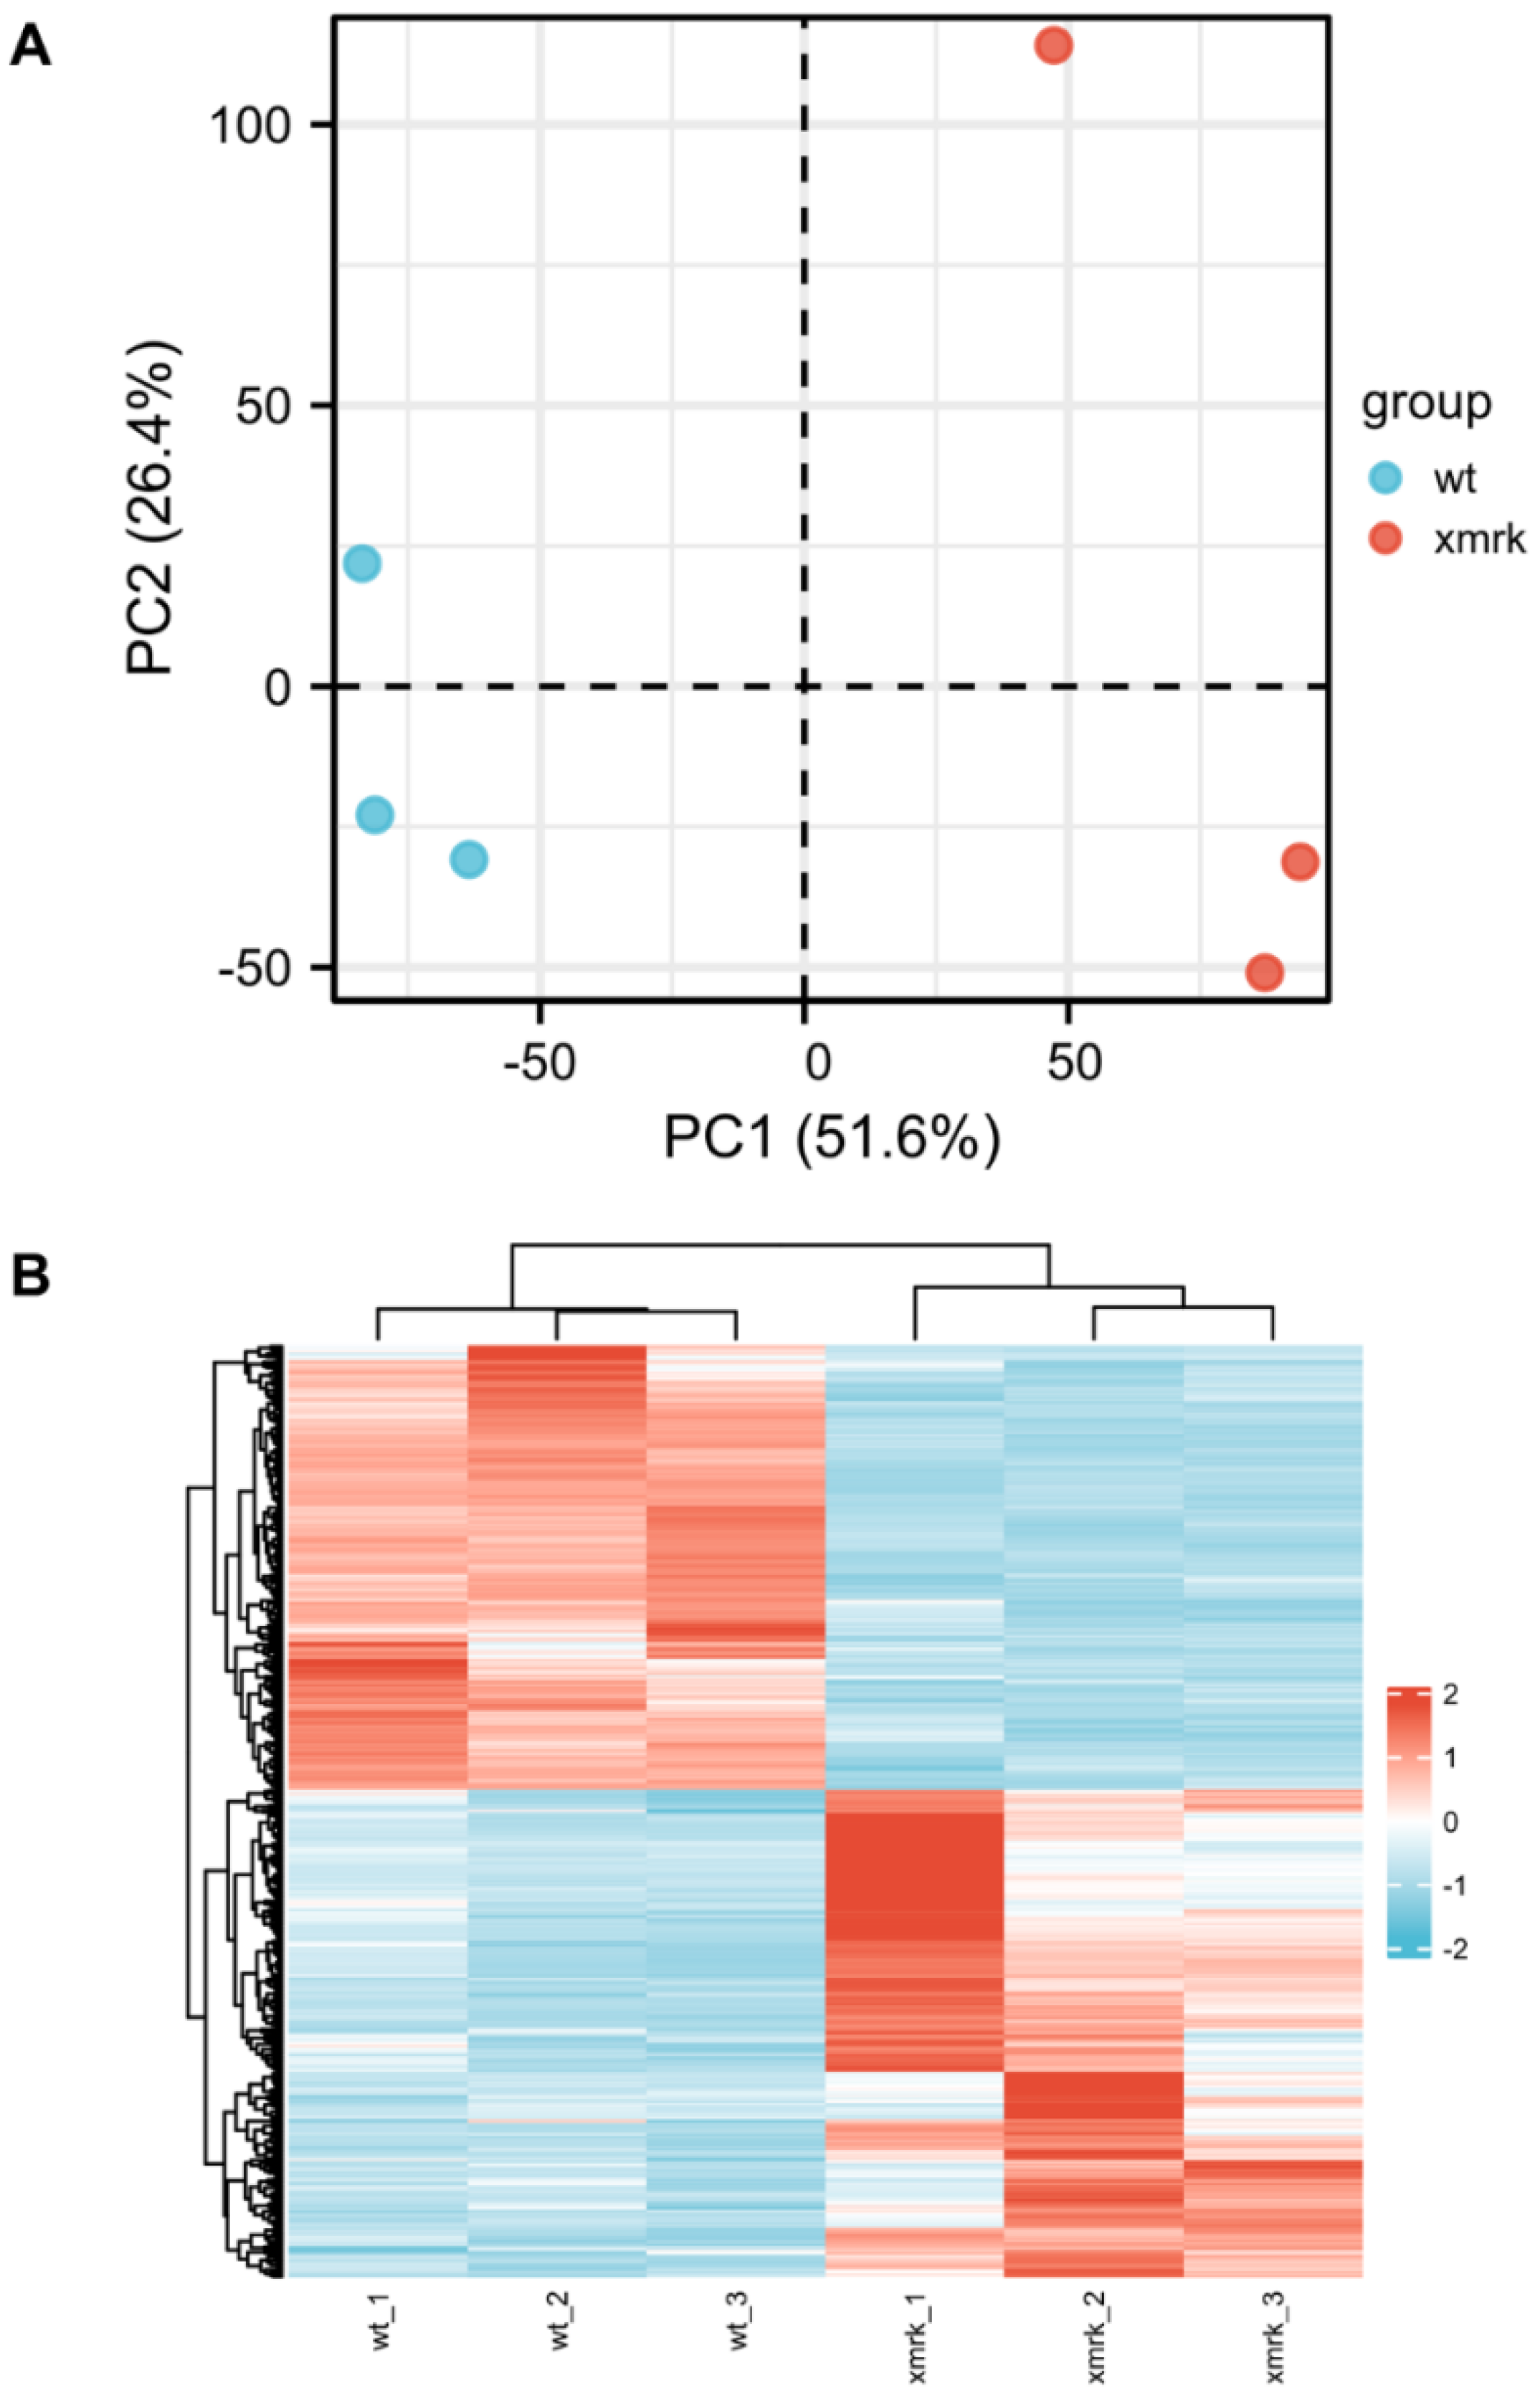
Fig. 5
Figure 5. Overview of RNA─seq data. (A) Principal component analysis (PCA) plot of wt and xmrk intestine datasets. (B) Hierarchical clustering of wt and xmrk intestine datasets and heatmap using differentially expressed genes (DEGs) with average TPM > 10. Values were row scaled using z─scores to show relative expression. Blue and red indicated low and high expression, respectively.
Acknowledgments
This image is the copyrighted work of the attributed author or publisher, and
ZFIN has permission only to display this image to its users.
Additional permissions should be obtained from the applicable author or publisher of the image.
Full text @ Cells