
Image
|
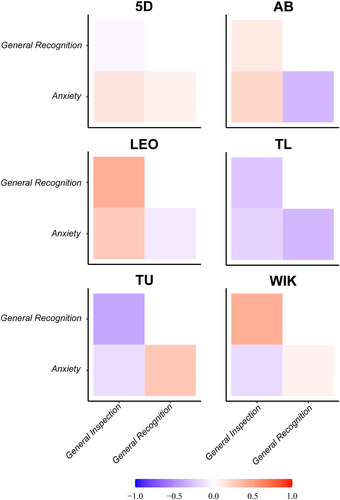
Figure Caption
Fig. 2
Phenotypic correlation matrices. Phenotypic correlation matrices for the behavioral components of General Inspection, General Recognition and Anxiety across six different zebrafish laboratory lines (i.e., populations). Color code represents correlation (r) values
Acknowledgments
This image is the copyrighted work of the attributed author or publisher, and
ZFIN has permission only to display this image to its users.
Additional permissions should be obtained from the applicable author or publisher of the image.
Full text @ Genes Brain Behav.