IMAGE

Fig. 4

ID
ZDB-IMAGE-220603-23
Source
Figures for Tanaka et al., 2022
Image
Figure Caption

Fig. 4

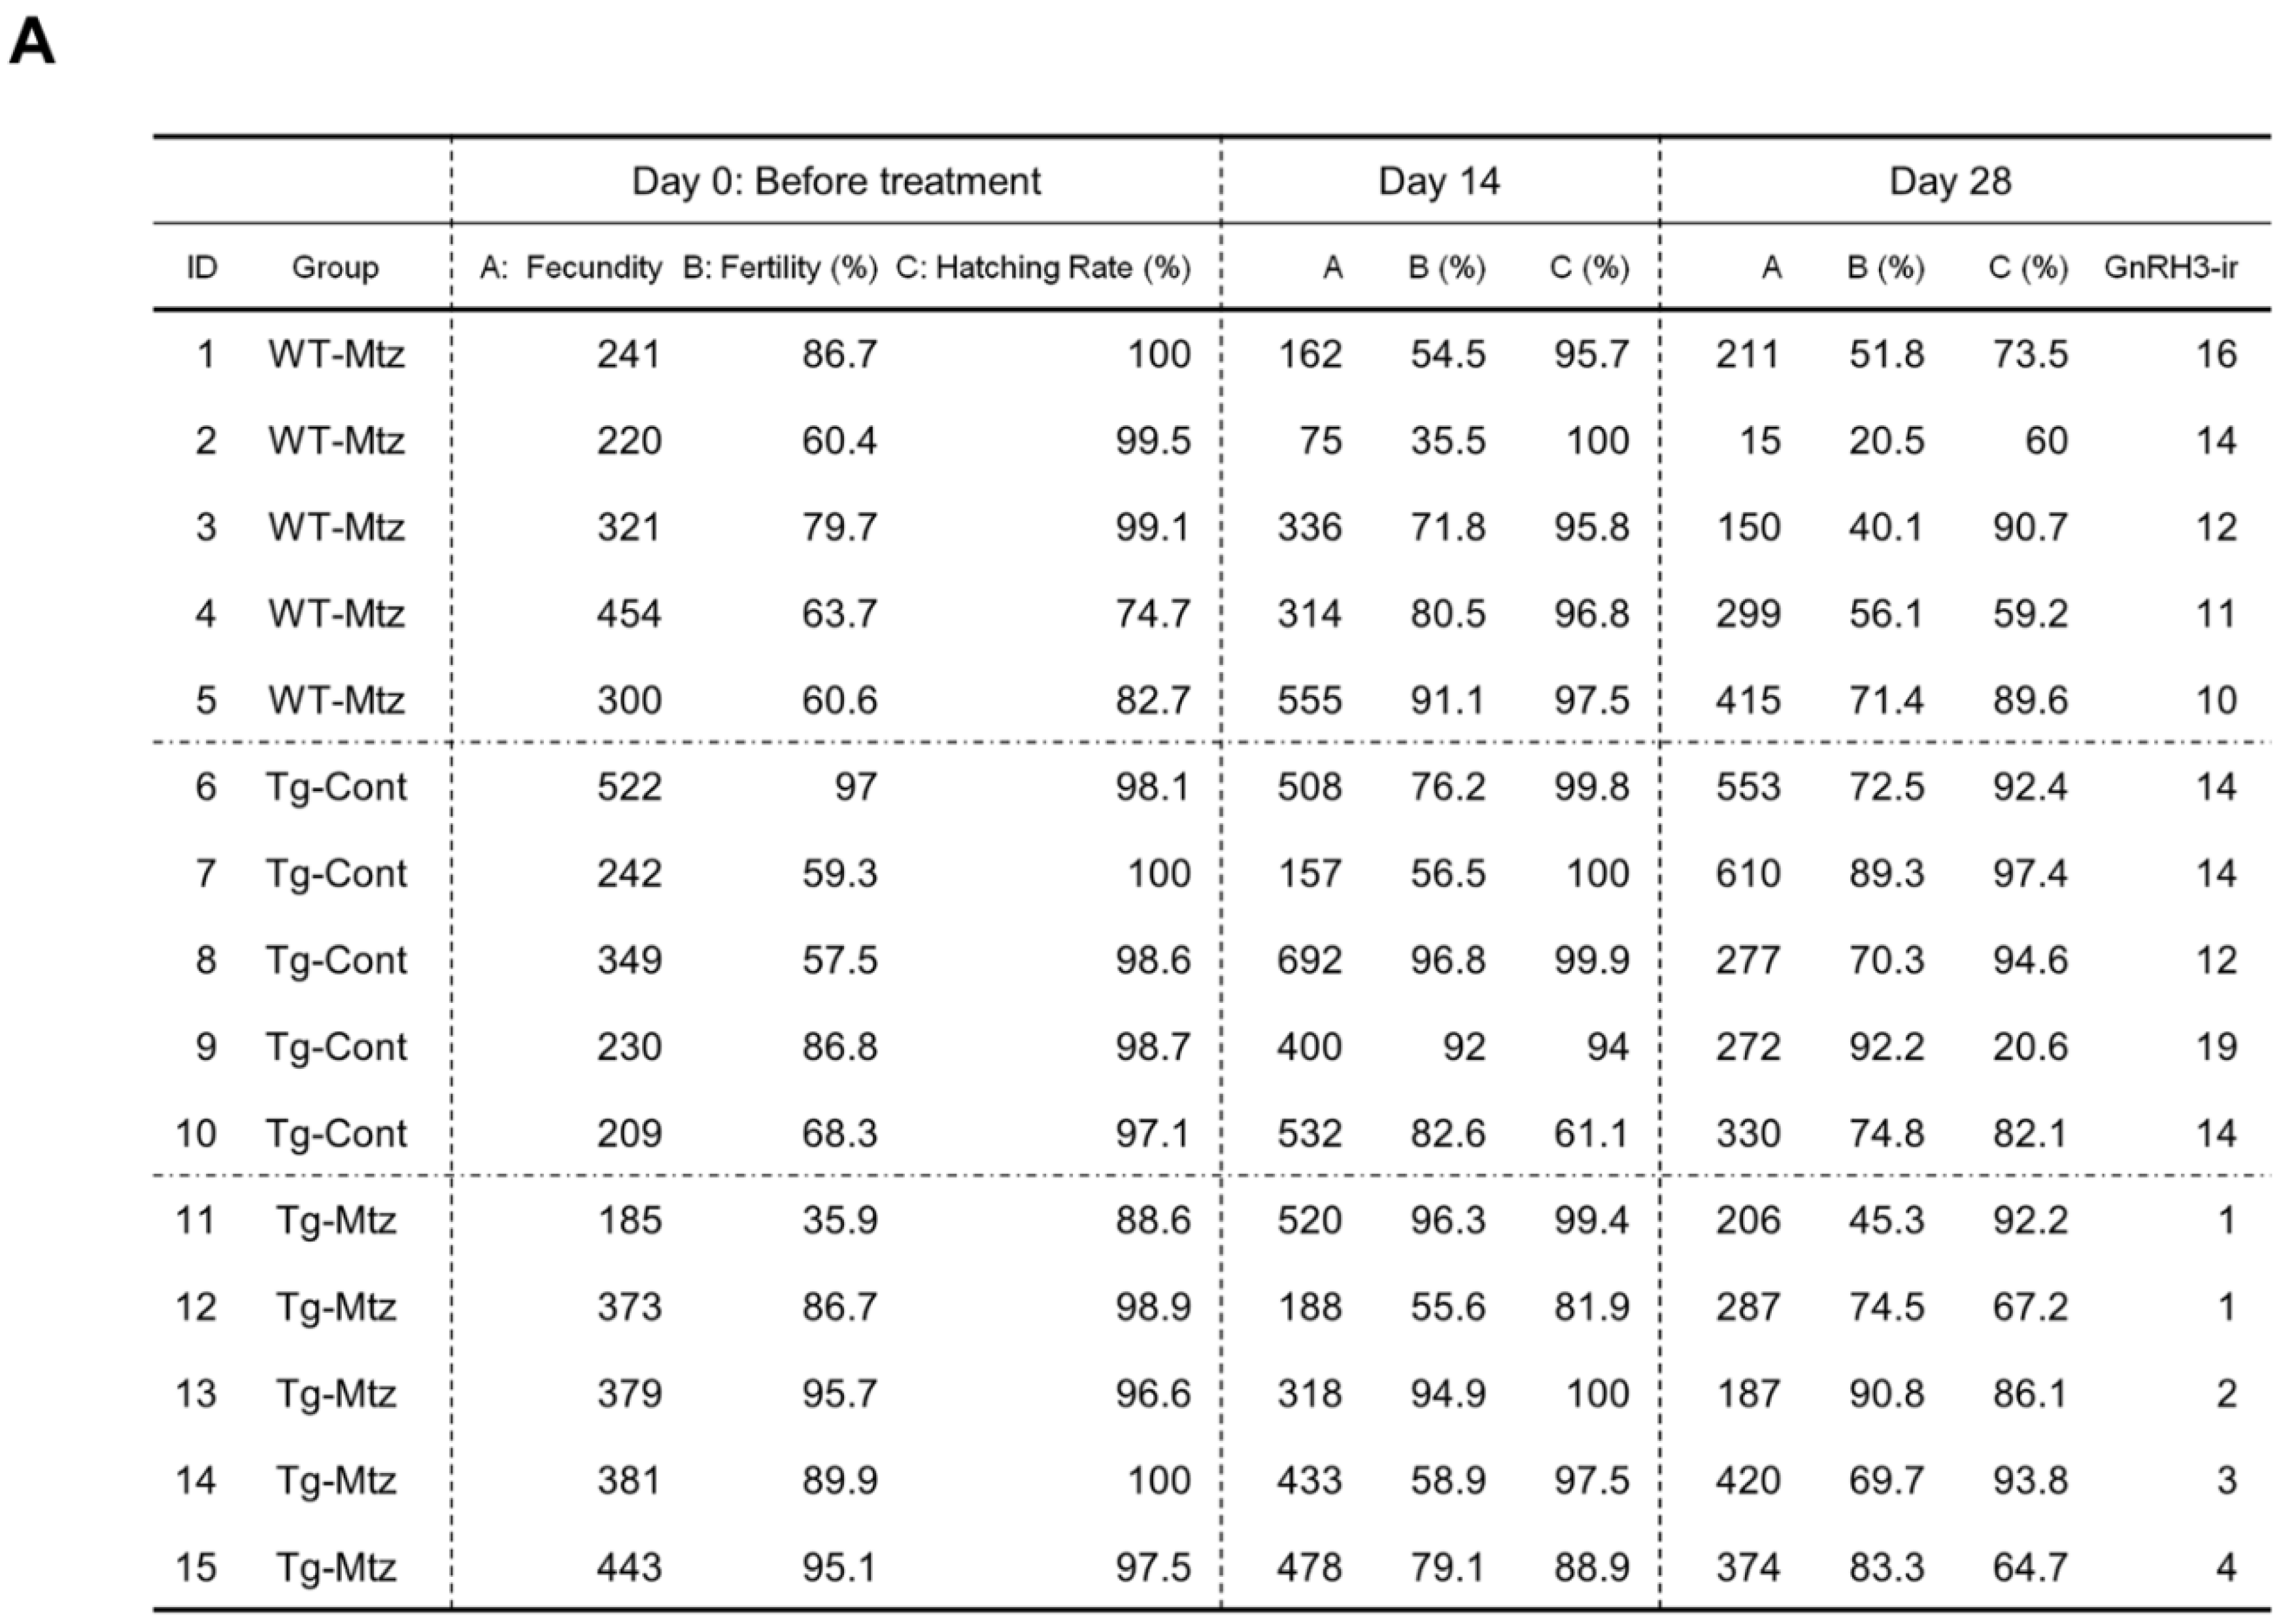
No correlation is observed between the number of detectable POA GnRH3 neurons and each reproductive parameter at 28 days of treatment. (A) Table depicting the number of remaining detectable GnRH3 immunoreactive (ir) neurons in the preoptic area, and the results of reproductive performance test for individual females from 0 days (before treatment) to 28 days of treatment. (B) Pearson’s correlation coefficient analysis between the number of POA GnRH3-ir cells and each reproductive parameter at 28 days of treatment. R, correlation coefficient. P, p-value. Data from A. WT-Mtz, WT siblings treated with 2 mM metronidazole (Mtz); Tg-Cont, Tg(gnrh3:Gal4ff; UAS:nfsb-mCherry) treated with vehicle; Tg-Mtz, Tg(gnrh3:Gal4ff; UAS:nfsb-mCherry) treated with 2 mM Mtz.

Acknowledgments
This image is the copyrighted work of the attributed author or publisher, and ZFIN has permission only to display this image to its users. Additional permissions should be obtained from the applicable author or publisher of the image. Full text @ Int. J. Mol. Sci.