
|
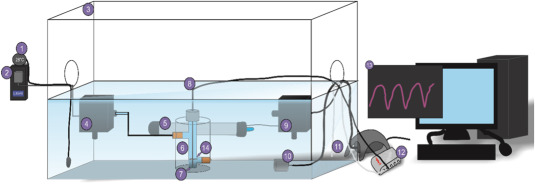
Fig. 1 Fig. 1. Stop-flow respirometry setup for larval fish. 1. Temperature meter. 2. AquaResp-controlled USB switch. 3. Recirculation tank. 4. Stop-flow pump controlled by USB switch. 5. Water heater (28°C). 6. Respirometry chamber. 7. Oxygen spot. 8. Fibreoptic probe. 9. Recirculation pump. 10. Air stone. 11. Temperature probe. 12. FireStingO2 Oxygen and Temperature Logger. 13. AquaResp software v.3. Larvae (14.) are placed in the respirometry chamber and acclimated for 1 h before measurements begin. AquaResp controls the stop-flow pump and logger to cycle through a series of flush-wait-measure steps (60 s, 10 s, 300 s), generating oxygen saturation curves. AquaResp generates regression curves and outputs MO2 data for each cycle.