Image
Figure Caption
Fig. 1
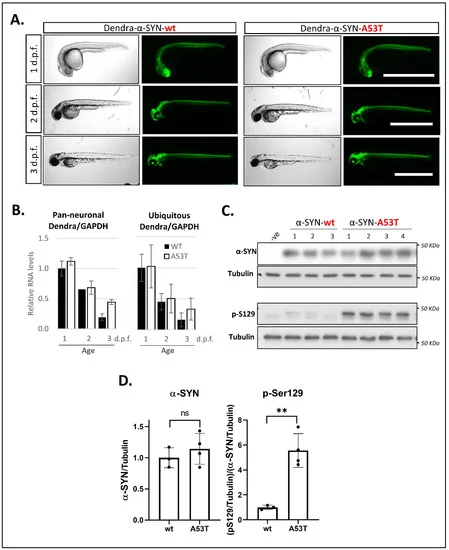
Figure 1. Expression of Dendra- α-SYN in transgenic zebrafish. (A) Representative brightfield and fluorescence images of Dendra-α-SYN positive offspring from stable UAS:Dendra-α-SYN-wt and A53T fish lines crossed to the PanN:Gal4VP16 driver fish at 1, 2 and 3 d.p.f. Expression localised to the CNS remains strong from 1 to 3 d.p.f. and does not result in morphological defects. Scale bar represents 1 mm. (B) Quantification by qPCR of the relative expression levels of Dendra/GAPDH in offspring from selected Dendra-α-SYN-wt (black) and A53T founder fish (white) showing comparable mRNA levels at 1, 2 and 3 d.p.f. when outcrossed to pan-neuronal or ubiquitous GAL4 driver lines (PanN:GAL4-VP16 and ubb:GAL4-VP16). Both groups showed reduced Dendra mRNA levels over time normalised by GAPDH. Data represents mean ± s.d. (N = 3 independent clutches for each age and genotype) (C) Western blot for total α-SYN and phosphorylated α-SYN at residue S129 (pS129) in whole fish lysates from 3 d.p.f. fish with pan-neuronal expression of Dendra-α-SYN-wt and A53T compared to tubulin levels as loading control. (D) Densitometry of total α-SYN and pS129 immunoblots in (C). The two transgenic lines had equivalent α-SYN levels relative to tubulin, whereas the levels of pS129 α-SYN were significantly increased in Dendra-α-SYN-A53T mutant fish, compared to α-SYN-wt (** p < 0.01 vs. α-SYN-wt).
Figure Data
Acknowledgments
This image is the copyrighted work of the attributed author or publisher, and
ZFIN has permission only to display this image to its users.
Additional permissions should be obtained from the applicable author or publisher of the image.
Full text @ Genes (Basel)

